
Key takeaways
- Volatility driven by ceasefire uncertainty: WTI crude surged above $102.25 to as high as $116 before reversing sharply, with an intraday whipsaw driven by conflicting signals around a potential US–Iran ceasefire and Trump’s rhetoric.
- Ceasefire expectations skewed to June: Prediction market assigns low odds of a ceasefire by end-April (~22.5%) but sees a higher probability (~51.5%) by end-June, keeping near-term geopolitical risk elevated.
- WTI bullish trend intact but key levels critical: The breakout above $102.25 signals a continuing bullish sequence, with upside toward $124–$132 if momentum holds, while a break below $102.25 risks a pullback toward $96–$93.
The West Texas oil CFD (a proxy of the WTI crude oil futures) has staged the expected bullish move, where it cleared above $102.25 per barrel and hit a closing level of $112.84 last Thursday, 2 April 2026, before the Easter holiday.
Market participants continue to discount the “optimism of a ceasefire deal” between the US and Iran from US President Trump’s social media posts and public speeches made in the past week.
In today’s early Asian session (Monday, 6 April 2026), the price actions of the West Texas oil CFD gapped up by 2.9% to print a current intraday high of $116.17, just shy of its 4-year high of $119.54 recorded on 9 March 2026, as the market digested the possibilities of further hostilities between US and Iran where Trump posted a social media with foul language, warning Iran’s power infrastructure will be destroyed if Tehran does not open the Strait of Hormuz by Tuesday, 7 April 2026 8.00 p.m. Eastern Time (an extension of an earlier Monday deadline).
Interestingly, the earlier gains of the West Texas oil CFD were all wiped out as it declined by 2.3% at $110.27 at the time of writing.
Ceasefire hopes are the primary driver of the current intraday whipsawing in oil prices. An Axios report stated that the US, Iran, and a group of regional mediators are discussing terms for a potential 45-day ceasefire that may lead to a permanent end to the war. In addition, US President Trump said he plans a news conference on Monday at 1.00 p.m. Eastern Time.
Prediction market is still expecting a US-Iran ceasefire in June 2026
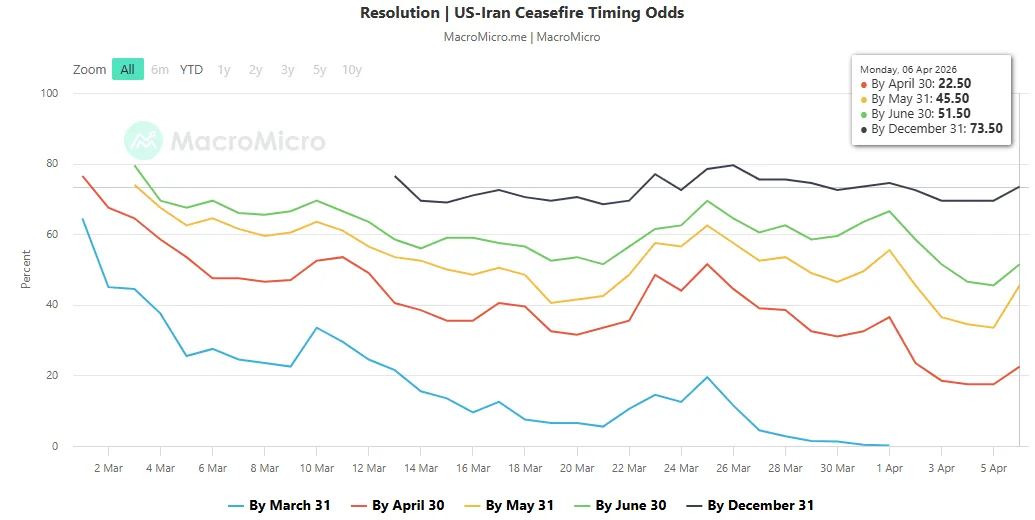
Fig. 1: Polymarket US-Iran ceasefire timing odds as of 6 Apr 2026 (Source: MacroMicro).
The above chart reflects the market-implied probability of an official ceasefire agreement between the US and Iran on various specific dates from the prediction market platform, Polymarket, where participants trade contracts based on the probability of future events.
As of Monday, 6 April 2026, the probability of a ceasefire by 30 April remains low at 22.5%, while the likelihood rises significantly to 51.5% by 30 June (see Fig. 1).
Let’s now focus on the potential short-term trajectory (1 to 3 days) of WTI crude oil from a technical analysis perspective
WTI Crude Oil – Minor bullish impulsive up sequence from 23 March 2026 low remains intact
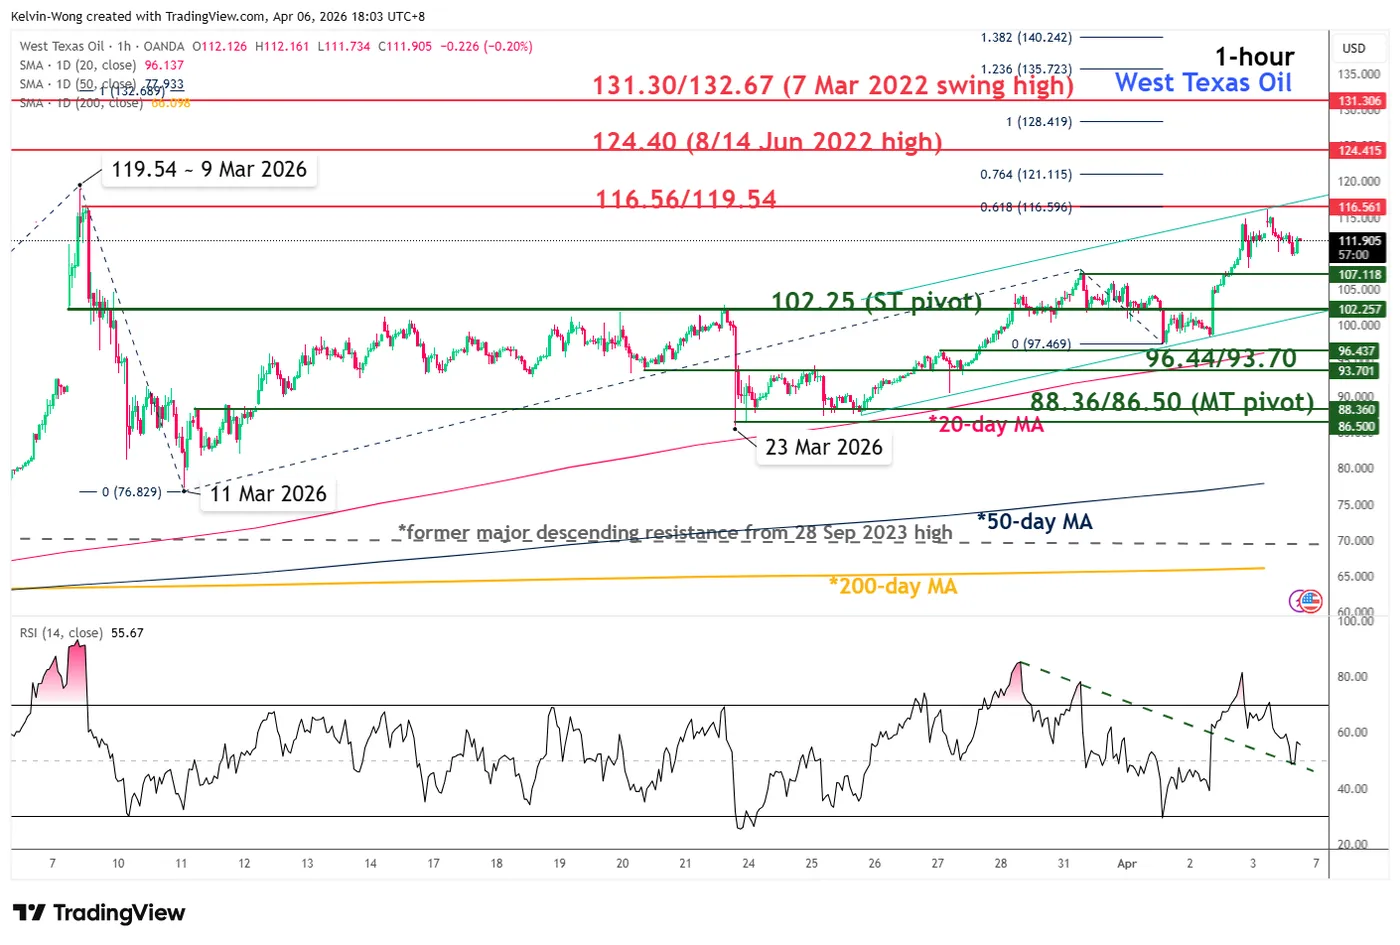
Fig. 2: West Texas Oil CFD minor trend as of 27 Mar 2026 (Source: TradingView).
The West Texas oil CFD (a proxy of the WTI crude oil futures) managed to stage a bullish breakout last Thursday, 2 April 2026, from a three-week sideways range configuration
Hence, a potential minor bullish impulsive up move sequence has kick-started from its 23 March 2026 low (see Fig. 2).
Watch the $102.25 short-term pivotal support to maintain the near-term bullish bias. A clearance above $116.56/119.54 sees the next intermediate resistances to come in at $124.40 and $131.30/132.67(also close to a Fibonacci extension cluster).
However, failure to hold at $102.25 and an hourly close below it negates the bullish tone for another round of minor corrective pull-back to retest the next intermediate support zone at $96.44/93.70 (also the 20-day moving average).
Key elements to support the near-term bearish bias on WTI crude oil
- The price actions have continued to oscillate within a minor ascending channel in place since the 23 March 2026 low, with its channel support coming in at around $102.25
- The hourly RSI momentum indicator is still holding above its pull-back support at around the 50 level.


