
Gold (XAUUSD) reached an all-time high of $5598.75 on January 29 before undergoing a notable correction. This decline unfolded in a 3 Elliott waves zigzag structure, ultimately finding support at $4094.63. We have identified this corrective phase as wave (IV). Since then, the metal has resumed its upward trajectory, entering wave (V). To fully confirm the bullish outlook, however, gold must decisively break above the prior peak of $5598.75. Without such a move, the risk of a double correction remains present.
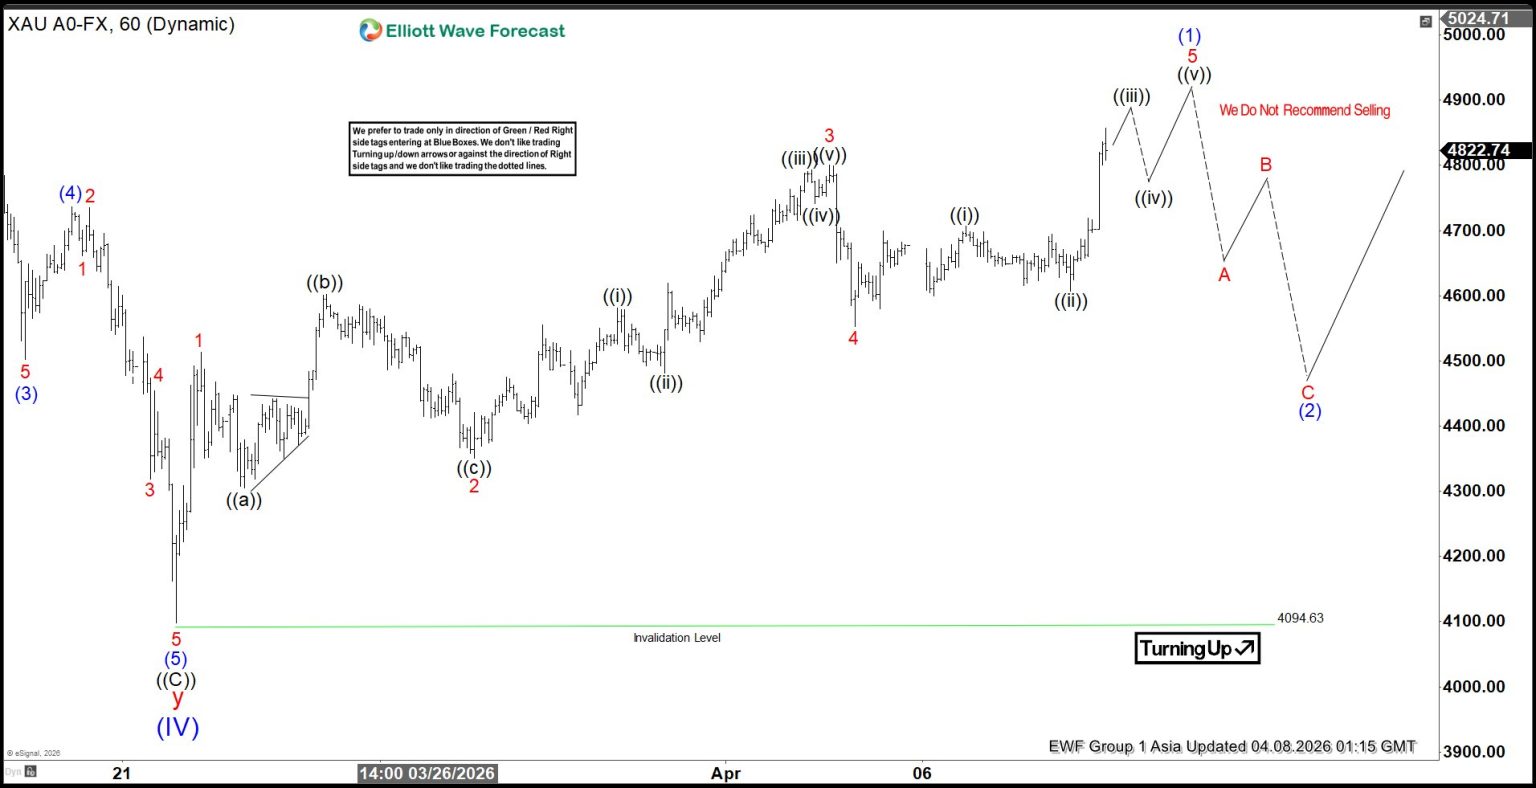
The short-term rally from the wave (IV) low has already displayed a five-swing structure. This pattern is characteristic of a motive sequence, which generally signals continuation rather than exhaustion. Consequently, the technical picture favors further upside momentum. From the wave (IV) base, wave 1 concluded at $4512.85, followed by wave 2 at $4350.52. Wave 3 extended higher to $4800.46, while the subsequent pullback in wave 4 ended at $4553.16. Current price action suggests that wave 5 is nearing completion. Once finalized, this will mark the end of wave (1) at a higher degree.
Afterward, gold is expected to retrace in wave (2). This corrective phase should address the cycle that began from the March 23 low. Such a pullback would be a natural development within the broader bullish structure, setting the stage for renewed strength. If the outlined progression holds, the metal could establish a sustainable advance beyond its previous record high.
Gold (XAUUSD) 60-Minute Elliott Wave Chart
XAUUSD Elliott Wave Video:
You are currently viewing a placeholder content from Default. To access the actual content, click the button below. Please note that doing so will share data with third-party providers.


 reached an all-time high of $5598.75 on January 29 before undergoing a notable correction. This decline unfolded in a 3 Elliott waves zigzag structure, ultimately finding support at $4094.63. We have identified this corrective phase as wave (IV). Since then, the metal has resumed its upward trajectory, entering wave (V). To fully confirm the bullish outlook, however, gold must decisively break above the prior peak of $5598.75. Without such a move, the risk of a double correction remains present.)