Nasdaq-100: ⬆️ Buy
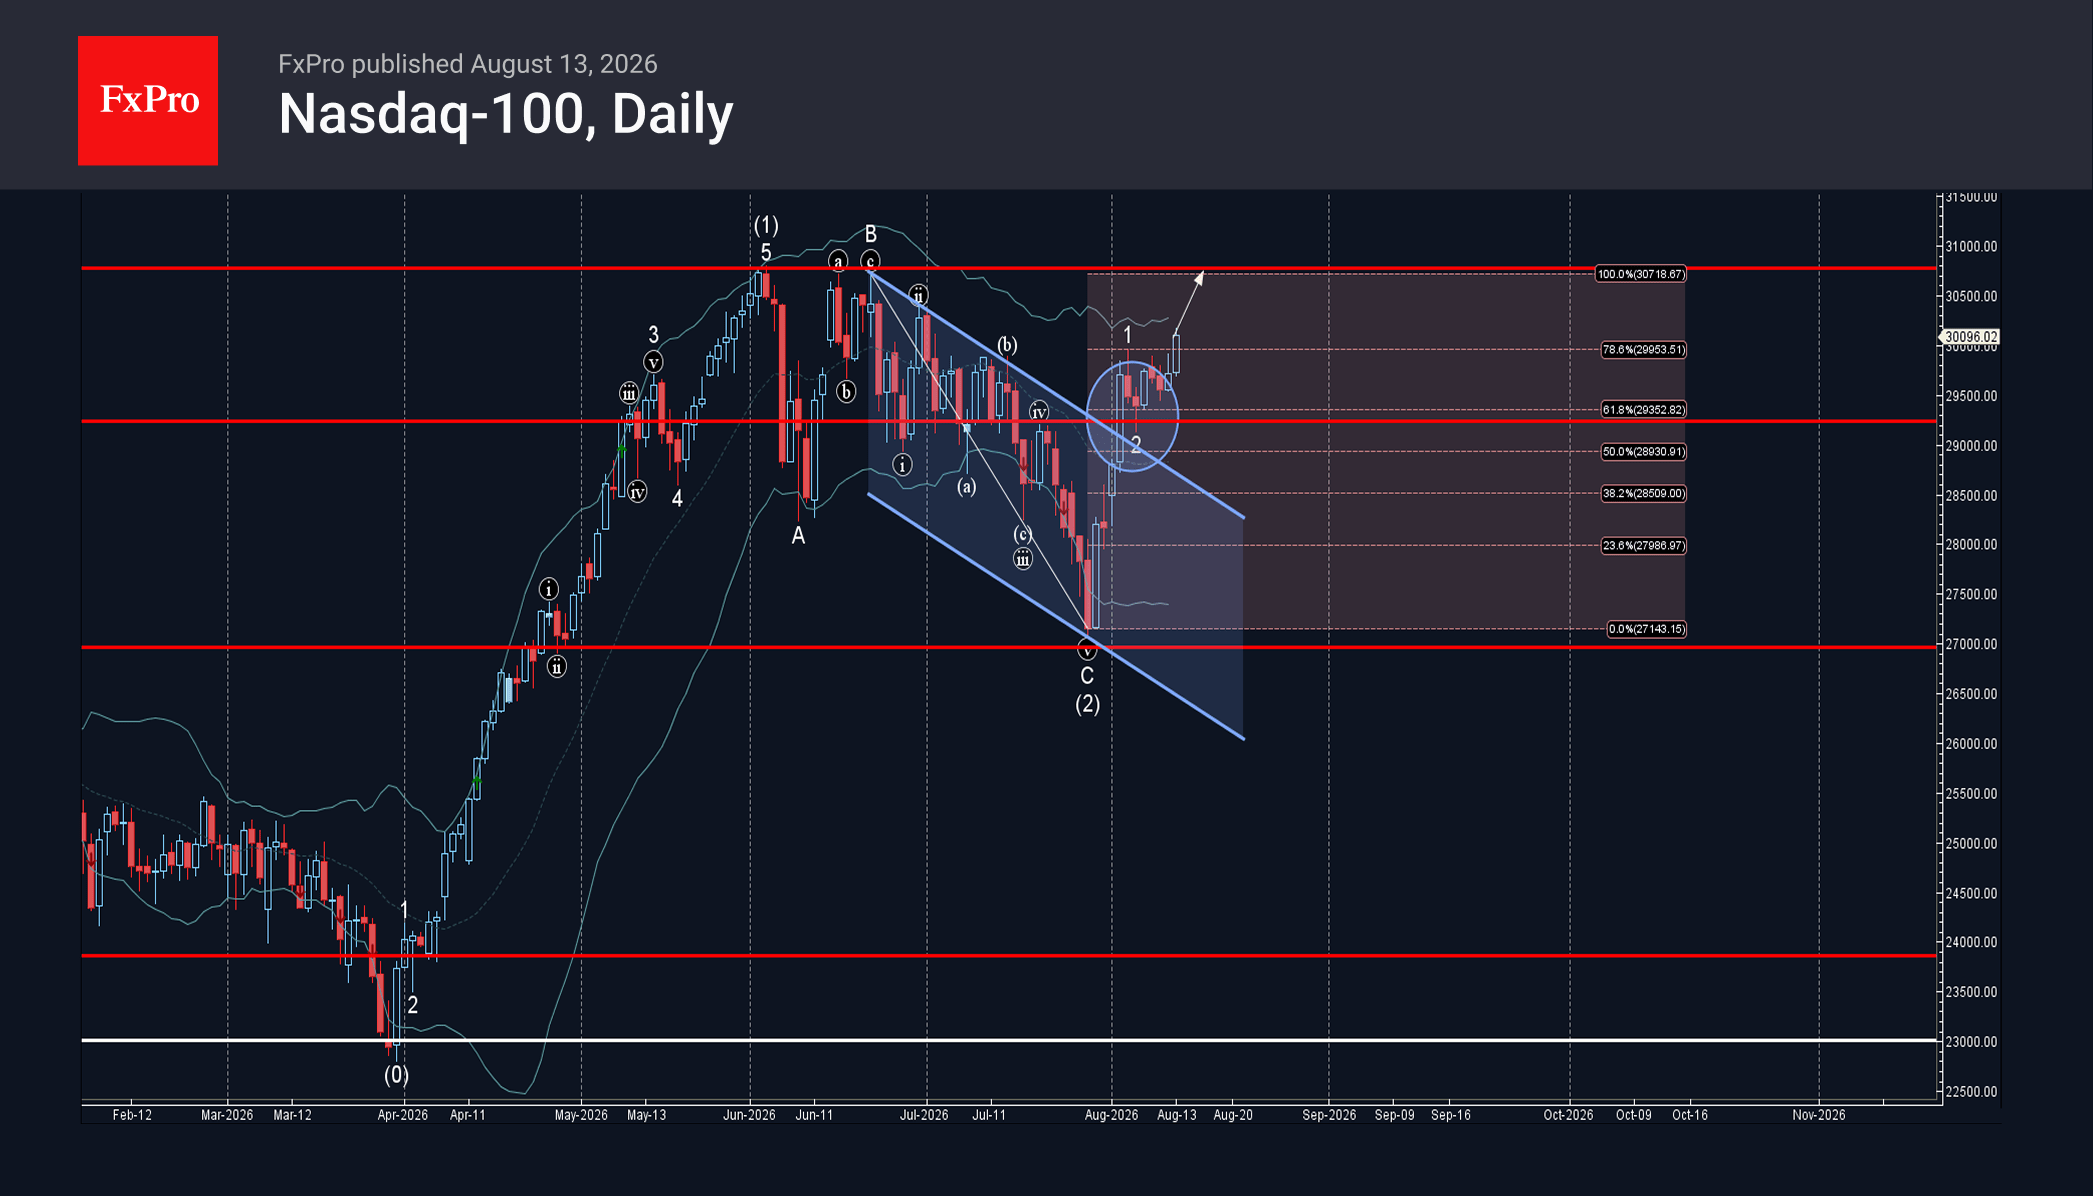
– Nasdaq-100 broke daily down channel
– Likely to rise to resistance level 30770.00
Nasdaq-100 index recently broke the resistance zone between the resistance trendline of the daily down channel from June intersecting with the 61.8% Fibonacci correction of the downward impulse C from June.
The breakout of this resistance zone accelerated the active minor impulse wave 3 that belongs to the intermediate impulse wave (3) from the end of July.
Given the prevailing uptrend, Nasdaq-100 index can be expected to rise further to the next resistance level 30770.00 – former double top from June.