


Key Highlights
- WTI Crude Oil corrected some gains from the $88.50 zone.
- It traded below a key bullish trend line with support at $86.40 on the 4-hour chart of XTI/USD.
- Gold started a consolidation phase below the $4,700 resistance.
- EUR/USD might start a pullback if it dips below 1.1620.
WTI Crude Oil Price Technical Analysis
WTI Crude Oil prices struggled to stay above $88.00 against the US Dollar. The price started a downside correction and traded below the $86.50 support.
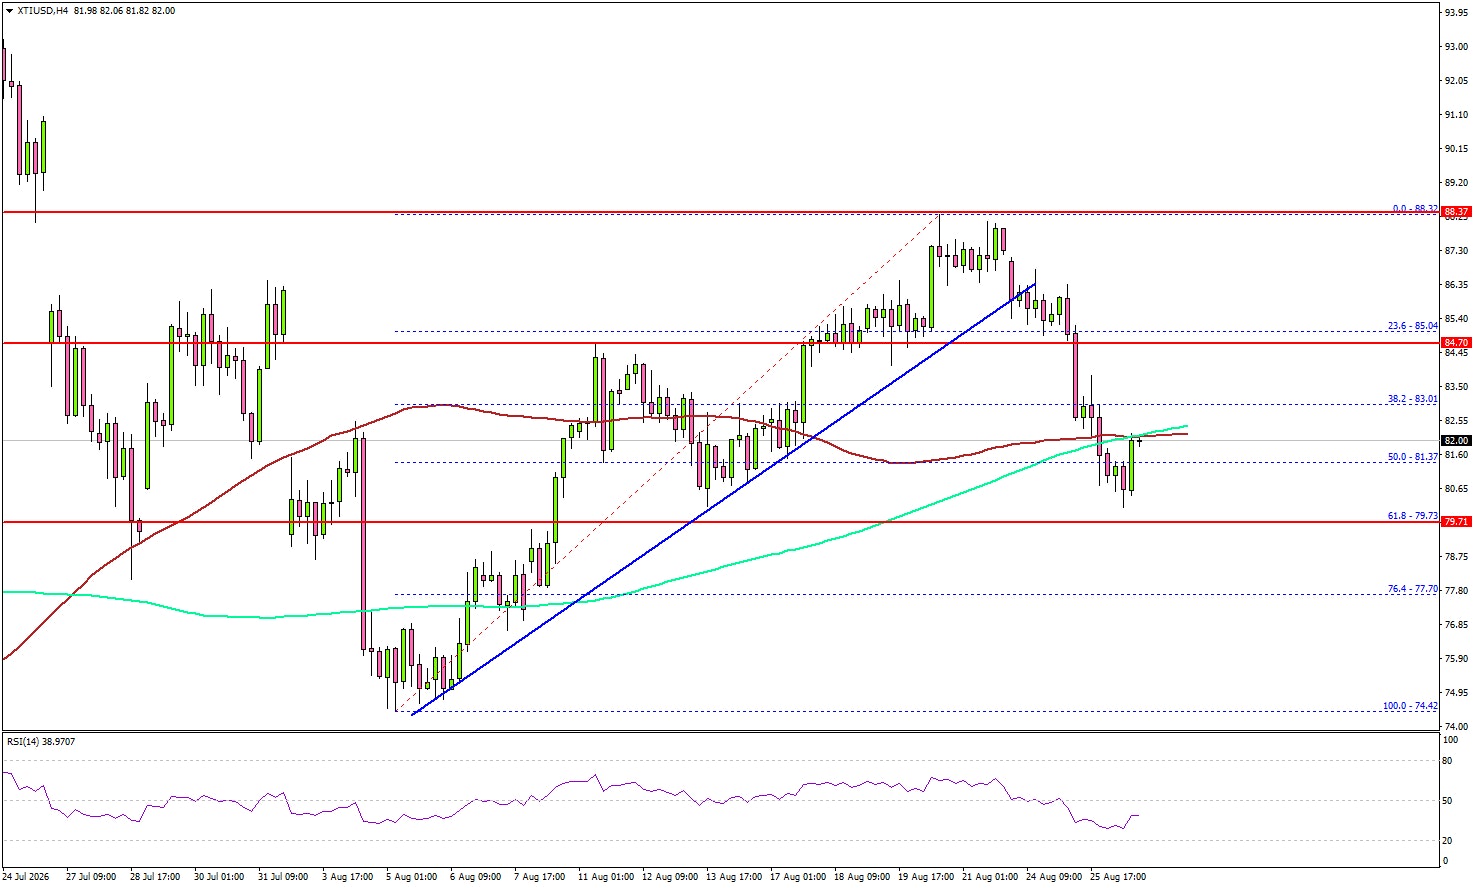
Looking at the 4-hour chart of XTI/USD, the price dipped below a key bullish trend line with support at $86.40, the 100 simple moving average (red, 4-hour), and the 200 simple moving average (green, 4-hour).
The price even spiked below the 50% Fib retracement level of the upward move from the $74.42 swing low to the $88.32 high. If there are more losses, the price might find support at $80.00.
The first major support could be near the $77.70 zone. The next support might be $76.80. The main support might be $75.50. A close below $75.50 might even push the price toward $72.00.
On the upside, the price could face resistance at $83.20. The next resistance might be $84.70. The main hurdle for steady gains could be $88.50. A close above $88.50 could send Oil prices toward $94.00.
Looking at Gold, the price started a decent increase, but it must settle above $4,700 to continue higher in the near term.
Economic Releases to Watch Today
- US Initial Jobless Claims – Forecast 208K, versus 206K previous.





