


As of 12 October 2026, the fundamental backdrop for XAU/USD remains mixed, with gold receiving moderate support from a weaker US dollar and geopolitical uncertainty. In the coming days, investors will focus on US inflation data and the outlook for Federal Reserve policy.
According to market estimates, the probability of a Fed rate hike in October is around 17%, rising to around 86% by December.
According to the World Gold Council (WGC), global gold ETFs attracted 10 billion USD in September, with inflows for the July–September quarter reaching a record 31 billion USD. Total fund holdings rose to a record 4,256 tonnes, indicating continued investor interest in gold as a diversification tool.
Geopolitical uncertainty and reserve diversification continue to support defensive demand. Uncertainty surrounding conflicts and concerns over the sustainability of public finances are keeping gold attractive. According to analysts, central bank purchases and efforts to reduce dependence on the US dollar have become structural factors supporting the market.
Against this backdrop, gold prices may continue to rise and reach their highest levels of the year in the near term.
Technical Analysis
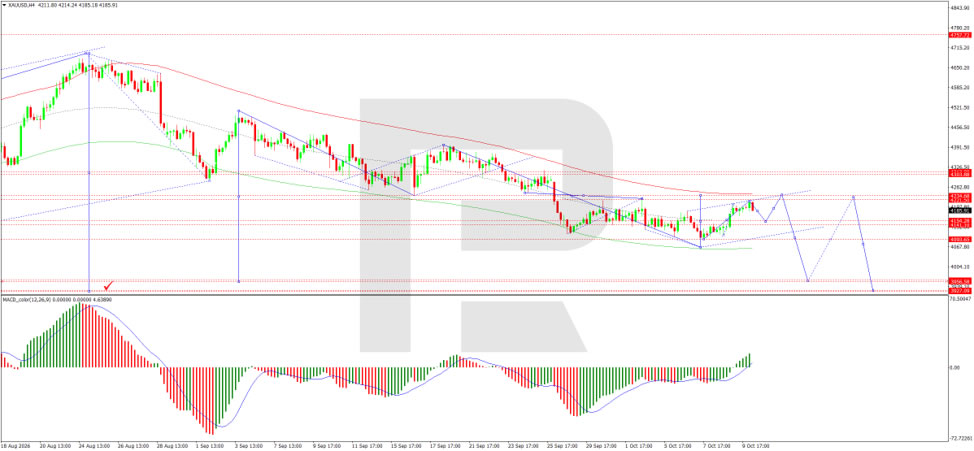
On the H4 chart, XAU/USD formed an upward corrective wave towards 4,217 USD within the persistent medium-term downtrend. A pullback from the recent high is currently underway, accompanied by the formation of a local consolidation range. During today’s trading session, the correction may continue towards the 4,160–4,150 USD area, where the nearest support zone is located. Holding above this range could allow the pair to resume its rise towards resistance at 4,234 USD. A break above this level would open the way for a move towards 4,255 USD. However, the main medium-term scenario remains a resumption of the decline, with the prospect of reaching 4,093 USD and 4,027 USD. The MACD indicator confirms a short-term strengthening of buying momentum: the histogram is in positive territory, while the signal line is pointing upwards.
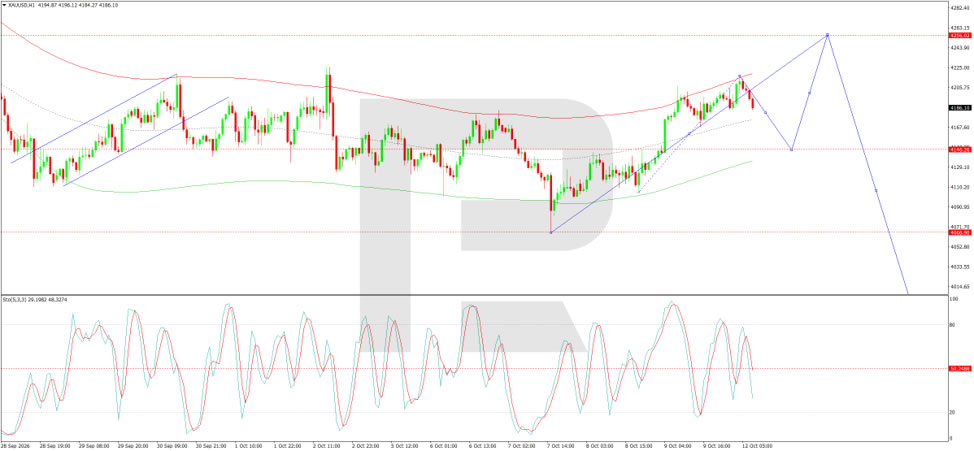
On the H1 chart, following a break above resistance at 4,141 USD, an upward wave developed, reaching the 4,217 USD area. The subsequent decline indicates the beginning of a local correction and weakening buying momentum. The immediate target is 4,146 USD, and holding above this level would allow the upward move to resume. A close below support would increase the likelihood of a decline towards 4,067 USD, followed by a test of 4,027 USD. The alternative scenario envisages a return above 4,217 USD, followed by a rise towards 4,255 USD. The Stochastic oscillator shows a bearish crossover of its signal lines in the middle of the range, confirming the likelihood of a continued correction. The short-term scenario therefore envisages an initial decline followed by a possible price recovery. The focus should be on the market’s reaction to support at 4,146 USD and resistance at 4,217 USD. Consolidation beyond either of these levels will determine the direction of the market during the remainder of the trading session.
Conclusion
Gold is receiving fresh support from a weaker US dollar, geopolitical uncertainty and record ETF inflows, which reached 10 billion USD in September and a quarterly record of 31 billion USD. Central bank purchases and reserve diversification remain structural drivers of demand, with the metal potentially revisiting this year’s highs. However, the medium-term technical picture remains bearish, with the current upward move viewed as a corrective wave within a broader downtrend. The key levels to watch are support at 4,146 USD and resistance at 4,217 USD, with a break below support potentially opening the way towards 4,067 USD and 4,027 USD, while a break above resistance could pave the way for 4,255 USD. The outcome will depend on US inflation data and Fed policy signals.





