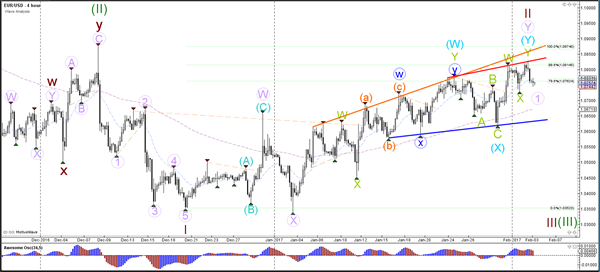
Currency pair EUR/USD
The EUR/USD showed a 2nd bearish bounce at the 88.6% level resistance level, which keeps the wave 2 (brown) structure intact. A break below the support (blue) trend line is needed before a bearish breakout is possible.
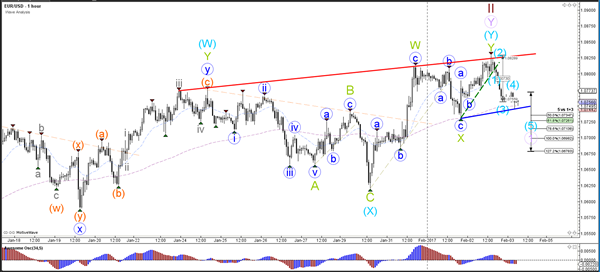
The EUR/USD is completing a bearish 5 wave pattern (blue) which could be either a wave A or 1 (purple).
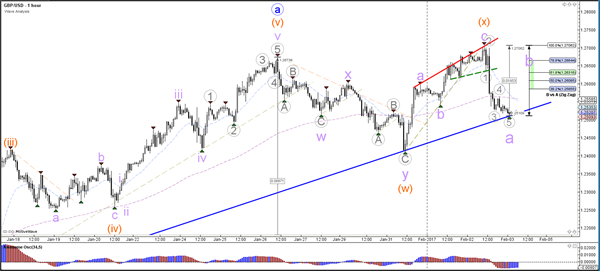
Currency pair GBP/USD
The GBP/USD showed a bearish bounce at the resistance trend line (red) and Fibonacci levels of wave X vs W. Price is now retesting the support trend line (blue) which is a bounce or break zone. A bearish breakout could price test the Fibonacci levels of wave B vs A (blue).
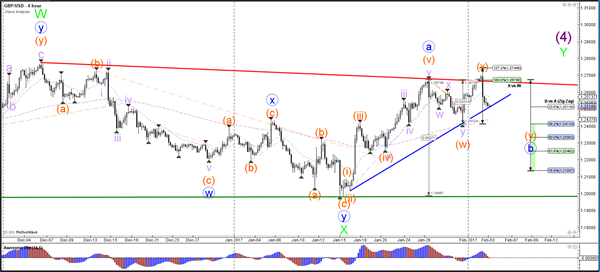
The GBP/USD broke below the rising wedge chart pattern (dotted greens) and fall impulsively in 5 bearish waves (grey). This price action could either be a wave 1 or wave A (purple) and a bullish bounce could be part of wave 2 or B (purple). The Fibonacci levels of wave B (purple) could stop price from moving higher but is invalidated if price breaks above the 100% Fibonacci level.
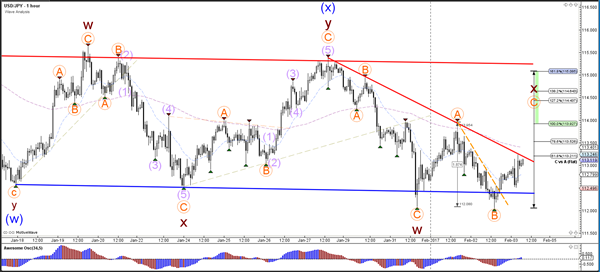
Currency pair USD/JPY
The USD/JPY is retracing back to the Fibonacci levels of wave 4 (purple). Either the 38.2% or 50% are likely bounce spots for such a wave 4 (purple).
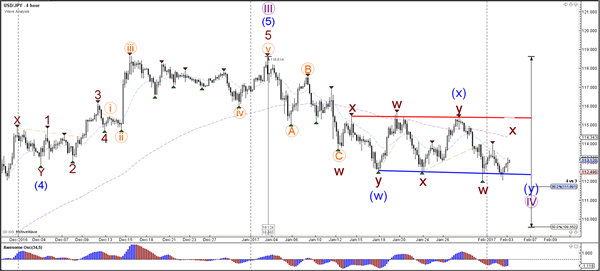
The USD/JPY broke above the resistance trend line (dotted orange) and is building a bullish ABC (orange) zigzag within wave X (brown). A break above the next resistance trend line (red) could price test the Fibonacci levels of wave C vs A.