
A note on lower timeframe confirming price action…
Waiting for lower timeframe confirmation is our main tool to confirm strength within higher timeframe zones, and has really been the key to our trading success. It takes a little time to understand the subtle nuances, however, as each trade is never the same, but once you master the rhythm so to speak, you will be saved from countless unnecessary losing trades. The following is a list of what we look for:
- A break/retest of supply or demand dependent on which way you’re trading.
- A trendline break/retest.
- Buying/selling tails – essentially we look for a cluster of very obvious spikes off of lower timeframe support and resistance levels within the higher timeframe zone.
- Candlestick patterns. We tend to only stick with pin bars and engulfing bars as these have proven to be the most effective.
EUR/USD
Weekly gain/loss: + 94 pips
Weekly closing price: 1.0784
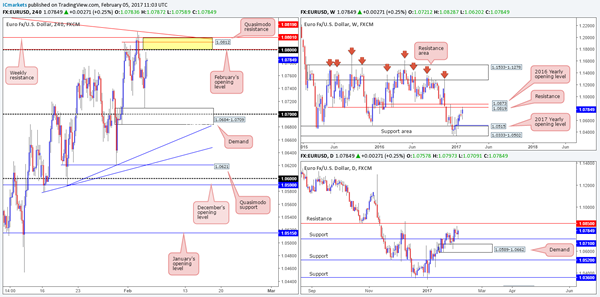
In spite of the prior week’s palpable selling wick, last week’s movement chalked up a nice-looking weekly bullish engulfing candle, which, as you can see, forced the pair to cross swords with a weekly resistance level coming in at 1.0819. This – coupled with the 2016 yearly opening level located just above it at 1.0873, could very well see buying fade this week.
On the other side of the coin, nonetheless, daily action recently bounced off daily support drawn from 1.0710 and shows room to extend north up to the daily resistance penciled in at 1.0850. While the weekly and daily timeframe structures are currently opposing one another, one thing to keep in mind here is that 1.0850 sits beautifully in between the aforementioned weekly resistance and 2016 yearly opening base. Therefore, at least in our opinion, this is a nearby zone to keep an eye on for shorting opportunities this week.
Friday’s US employment report published mixed figures. Non-farm employment change came in above expectations at 227k, whereas both the unemployment rate and average hourly earnings were less encouraging. The aftermath of the event initially sent the single currency to lows of 1.0709, clipping the top edge of a H4 demand base at 1.0684-1.0709, before reversing tracks and eventually clocking highs of 1.0797 on the day.
Our suggestions: Directly above current price on the H4 chart is a nice-looking area of resistance at 1.0819/1.08. Building a case for entry here we have the following structures in play (yellow zone): a psychological resistance barrier at 1.08, February’s opening level at 1.0801, a H4 Quasimodo resistance at 1.0812, a H4 trendline resistance extended from the high 1.0873 and finally we also have the weekly resistance mentioned above at 1.0819.
Although there is a possibility that price may fake through this H4 sell area to tap the daily resistance at 1.0850 and maybe even the 2016 yearly opening level at 1.0873, we still feel a short from the above noted H4 sell zone is something to consider. Whether you believe this area is stable enough to justify a trade without the need for additional confirmation is, of course, down to the individual trader. For us personally, we’re opting to wait for a reasonably sized H4 bearish candle to take shape before deciding if a trade from this zone is worthy of our capital. As of now, risk/reward from this region looks reasonably favorable given that the next downside target on the H4 scale comes in at the H4 demand mentioned above at 1.0684-1.0709.
Data points to consider: There are no scheduled high-impacting news events on the docket today relating to these two markets.
Levels to watch/live orders:
- Buys: Flat (stop loss: N/A).
- Sells: 1.0819/1.08 ([wait for a reasonably sized H4 bear candle to form before looking to execute a trade] stop loss: ideally beyond the trigger candle).
GBP/USD:
Weekly gain/loss: – 65 pips
Weekly closing price: 1.2478
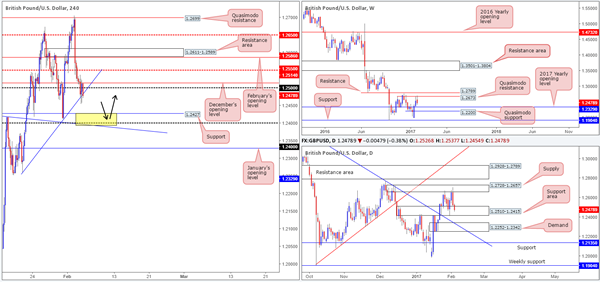
Over the last week, the weekly bulls were unable to gain much ground beyond the weekly Quasimodo resistance line at 1.2673, resulting in the unit breaking a two-week bullish phase and erasing almost 50% of the previous week’s gains. The next support target from this angle is reasonably nearby at 1.2329: the 2017 yearly opening level, followed relatively closely by a weekly Quasimodo support at 1.2200.
Moving down to the daily timeframe, we can see that Thursday’s candlestick printed a strong-looking daily bearish engulfing candle out of a daily supply zone coming in at 1.2728-1.2657. As you can see, follow-through selling was seen during Friday’s segment, but failed to overcome the daily support area registered at 1.2510-1.2415. Should a breakdown through this barrier take place this week, this will bring the daily demand zone at 1.2252-1.2342 in view, which happens to converge nicely with the 2017 yearly opening level mentioned above, and also a daily trendline support extended from the high 1.3437.
A quick recap of Friday’s movement on the H4 shows that a rather muted response transpired following the release of the US monthly employment figures. The H4 candles were seen capped by December’s opening level at 1.2514 and a H4 trendline support stretched from the low 1.2260. That being said though, the week did in fact end with a (H4) close below the above noted H4 trendline support, indicating further selling may be on the cards today down to H4 support registered at 1.2427.
Our suggestions: 1.2427 is a noteworthy area of support, in our opinion. Not only is it housed within the lower limits of the daily support area at 1.2510-1.2415, it’s also seen in close proximity to the 1.24 handle and H4 trendline support drawn from the high 1.2432 (yellow zone). The only grumble we have concerning a buy trade from here is that weekly price, as mentioned above, looks as though it wants to cross swords with the 2017 yearly opening level, which is located around the top edge of daily demand at 1.2252-1.2342. So, there is a chance that price may ignore our pre-determined H4 buy zone!
Therefore, In order for this zone to be considered a valid area of support, we would need to see a reasonably sized H4 bull candle form from within the walls of this neighborhood. Only then would our desk look to buy, targeting the 1.25 band as an initial take-profit zone.
Data points to consider: There are no scheduled high-impacting news events on the docket today relating to these two markets.
Levels to watch/live orders:
- Buys: 1.2390/1.2427 ([wait for a H4 bull candle to form before looking to execute a trade] stop loss: ideally beyond the trigger candle).
- Sells: Flat (stop loss: N/A).
AUD/USD:
Weekly gain/loss: + 136 pips
Weekly closing price: 0.7679
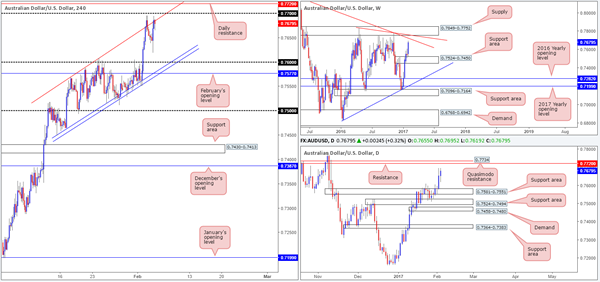
Following a brief pause in action two weeks back the weekly bulls resumed bidding price to the upside last week. This saw the market settle for the week within striking distance of a weekly trendline resistance taken from the high 0.8163, followed closely by a weekly supply zone logged in at 0.7849-0.7752 (bolstered by yet another weekly trendline resistance stretched from the high 0.7835). As such, there’s a possibility that the buying pressure may diminish this week.
Positioned nearby the oncoming weekly trendline resistance (0.8163) is a daily Quasimodo resistance penciled in at 0.7734 and a daily resistance at 0.7720. This, along with the underside of weekly supply at 0.7752 defines what our team would label as a strong-looking sell zone with attractive confluence.
The aftermath of Friday’s US employment release initially saw price dip to lows of 0.7619, before reversing and exploding to the upside, ending the week shaking hands with the H4 channel resistance band drawn from the high 0.7569. While a downside move from this angle is feasible today, it’s likely that we’ll see price edge north and attack offers located around the 0.77 handle, and quite possibly the nearby daily resistance level at 0.7720. Strengthening this possibility is that Aussie retail sales is estimated to have improved, which if it turns out be the case, this would very likely be enough to lift prices up to the higher-timeframe resistance structures discussed above.
Our suggestions: Obviously dependent on the Aussie retail sales figures, our desk favors the 0.7752/0.7722 region (underside of weekly supply and daily resistance at 0.7720) as an area of promising resistance today. Entering from here without waiting for additional confirmation, however, is not something we’d recommend! Ideally, we’d like to see price strike the above noted higher-timeframe area and print a H4 bearish close back below the 0.77 handle. Only then would we consider a sell trade, targeting the lower edge of the H4 channel support taken from the low 0.7449.
Data points to consider: Aussie retail sales scheduled to be released at 12.30am GMT.
Levels to watch/live orders:
- Buys: Flat (stop loss: N/A).
- Sells: 0.7752/0.7722 ([a H4 bearish close back below the 0.77 handle is required before looking to execute a trade] stop loss: ideally beyond the trigger candle).
USD/JPY
Weekly gain/loss: – 250 pips
Weekly closing price: 112.55
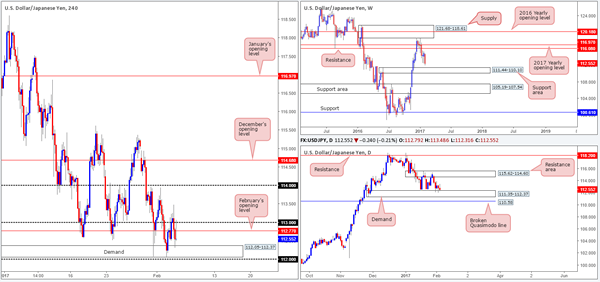
After printing back-to-back weekly buying tails, little follow-through emerged last week with price action penciling in a near-full-bodied weekly bearish candle and touching a fresh low of 112.05. The other key thing to note here is the fact that price is now seen trading within shouting distance of a weekly support area marked at 111.44-110.10, which, in our opinion, has the potential to at least stall prices this week.
Since Tuesday, the daily candles have been bouncing off the top edge of a daily demand area drawn from 111.35-112.37, which happens to be positioned around the upper limit of the aforementioned weekly support area. A breakdown into this daily zone would not only see weekly price tag the weekly support area, but it could also pull prices beyond the current daily demand down to a nearby daily broken Quasimodo line at 110.58.
The after-effects of Friday’s US employment report saw a rapid spike to highs of 113.47, before withdrawing lower back down to the upper wall of a H4 demand coming in at 112.05-112.37. As of current price, the pair is somewhat sandwiched in between this H4 demand base and February’s opening level at 112.77.
Our suggestions: A buy trade could be possible around the current H4 demand area, seeing as how it is reinforced by the daily demand zone mentioned above at 111.35-112.37. Still, traders need to be prepared for a violation of this H4 barrier down to around the H4 mid-way point at 111.50, since this is where the top edge of the current weekly support area is located!
In view of how deep price has already driven into the H4 demand, we will not be looking to buy from here today.
Data points to consider: There are no scheduled high-impacting news events on the docket today relating to these two markets.
Levels to watch/live orders:
- Buys: Flat (stop loss: N/A).
- Sells: Flat (stop loss: N/A).
USD/CAD:
Weekly gain/loss: – 129 pips
Weekly closing price: 1.3019
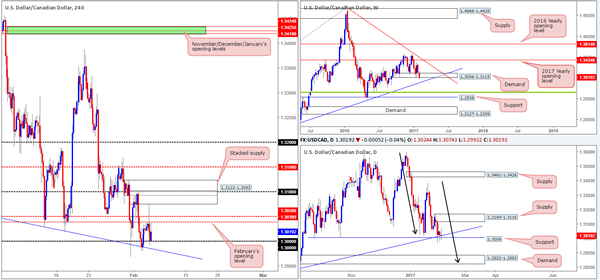
Weekly demand at 1.3006-1.3115 looks as if it’s hanging on by just a thread at the moment! With that in mind, beneath this base sits a weekly trendline support extended from the high 1.1278 that could, given the force of last week’s bearish descent, come into play this week.
Zooming in and looking at the daily picture, the pair established support around the 1.3006 region last week which converges with a daily trendline support extended from the low 1.2654. Of particular interest here is the series of higher lows that formed from Wednesday onwards. While this does somewhat reflect a bullish tone here, we also have to take into account that Friday’s session chalked up an indecision candle with a slight bearish edge to it and, in addition to this, price is potentially in the process of forming the D-leg to a daily AB=CD symmetrical bull pattern that terminates at an area below the current daily support: a daily demand base coming in at 1.2822-1.2883 (see black arrows).
Having posted a daily high of 1.3074 moments after Friday’s US employment release, we can see that the H4 candles failed to sustain gains beyond the H4 mid-way resistance point at 1.3050. As a result, the key figure 1.30 was brought into play shortly after, which, as is evident from the H4 chart, remained firm into the week’s closing bell.
Our suggestions: To our way of seeing things, this is quite a difficult market to trade at the moment. On the one hand we have what appears to be a fading weekly demand area, and on the other hand, there are signs of bullish life around the current daily support level! Although 1.30 has effectively held ground, upside from this angle is relatively limited. February’s opening level at 1.3039 sits just above, alongside the H4 mid-way resistance 1.3050. Given these factors, our team will lay low going into Monday’s session and look to reassess on Tuesday.
Data points to consider: There are no scheduled high-impacting news events on the docket today relating to these two markets.
Levels to watch/live orders:
- Buys: Flat (stop loss: N/A).
- Sells: Flat (stop loss: N/A).
USD/CHF:
Weekly gain/loss: – 76 pips
Weekly closing price: 0.9913
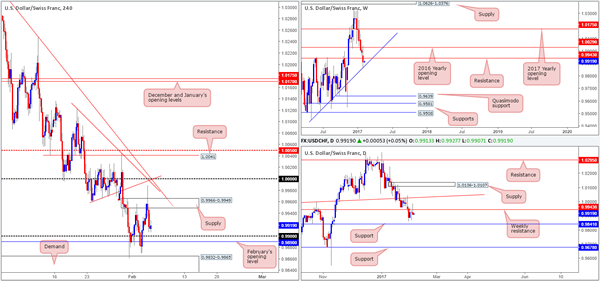
Last week’s descent marks the pair’s sixth consecutive losing week, with the unit managing to touch a low of 0.9861. The pair munched through weekly support at 0.9943 (now acting resistance), and concluded the trading week rebounding from a weekly trendline support taken from the low 0.9443. Any sustained move below this line would likely place the weekly Quasimodo support at 0.9639 in the firing range.
On the other side of the ledger, however, daily flow retested the underside of the aforementioned weekly resistance on Friday and printed a nice-looking daily selling wick. With very little daily support seen to the downside until 0.9841, this will likely encourage further selling in this market today/early this week.
Sparked by Friday’s US employment numbers, H4 action blasted to a high of 0.9988, missing parity (our pre-determined H4 sell zone) by only a few pips! The advance, nevertheless, as you can see, was a short-lived one. The pair tumbled to lows of 0.9906, ending the day closing just ahead of the 0.99 handle and nearby February opening level at 0.9890.
Our suggestions: While selling the daily bearish candle is tempting, it’s not something we’d advise. Not only do you have potential weekly buyers in play right now (see above), but you also have to contend with the possibility that 0.99/0.9899 on the H4 chart could put the brakes on any today! What’s more, even with a break below this H4 barrier, H4 demand at 0.9832-0.9865 is seen just below, which happens to merge with the daily support level discussed above at 0.9841! As a result of this, opting to stand on the sidelines may very well be the better path to take today.
Data points to consider: There are no scheduled high-impacting news events on the docket today relating to these two markets.
Levels to watch/live orders:
- Buys: Flat (stop loss: N/A).
- Sells: Flat (stop loss: N/A).
DOW 30:
Weekly gain/loss: – 19 points
Weekly closing price: 20056
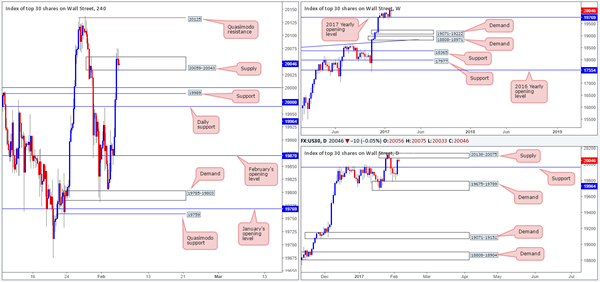
During the course of last week’s session, although the DOW closed marginally in the red we did see the unit chalk in a nice-looking weekly bullish tail that missed clipping the 2017 yearly opening level at 19769 by only a few points. In view of this, there are absolutely no weekly resistance levels in this market right now. Therefore, the best we can do for the time being is continue looking to ‘buy the dips’.
However, before our team looks to buy medium term, we will need to see daily price engulf the nearby daily supply coming in at 20138-20075. As we write, the candle action is currently responding to the lower edge of this base and could send the market back down to retest daily support at 19964.
Stepping across to the H4 candles, we can see that US stocks rallied following Friday’s US employment report, forcing the market to stab above H4 supply at 20059-20043 going into the close. Right now, the H4 bears remain steady within this zone, but have yet to make any noteworthy push to the downside. The next level of interest seen from this area comes in at 20000, followed closely by the H4 support at 19989.
Our suggestions: Regardless of the weekly chart (see above), both the daily and H4 charts indicate that selling could be the key theme today. In order for us to become sellers here, however, a lower-timeframe sell signal (see the top of this report) would need to take shape within the walls of the current H4 zone.
Data points to consider: There are no scheduled high-impacting news events on the docket today that will likely affect the US equity market.
Levels to watch/live orders:
- Buys: Flat (stop loss: N/A).
- Sells: 20059-20043 ([waiting for a lower-timeframe signal to form is advised prior to pulling the trigger] stop loss: dependent on where one confirms this area).
GOLD
Weekly gain/loss: +$28.9
Weekly closing price: 1219.8
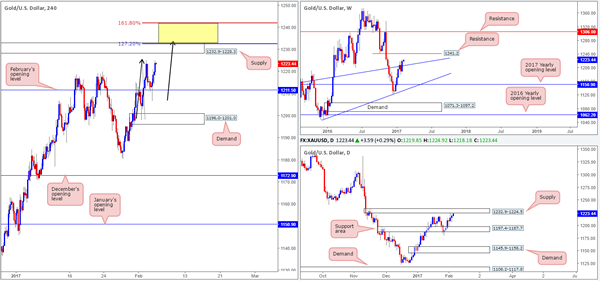
From the weekly chart this morning, it’s clear to see that the latest action overcame the weekly trendline resistance taken from the low 1130.1, and now could possibly be heading toward the weekly resistance pegged at 1241.2. Ultimately though, in order for this to be achieved, the daily supply zone drawn in at 1232.9-1224.5 would need to be consumed. However, with that daily zone out of the picture, this does not leave a lot of wiggle room before price touches base with the above noted weekly resistance.
Looking over to the H4 candles, Friday’s movement spiked below February’s opening level at 1211.5 following the release of the US employment figures, but, as you can see, managed to recover relatively quickly and advance to a high of 1221.2 by the closing bell. Of note here is the H4 AB=CD bearish pattern (see black arrows) that looks as if it will complete its D-leg today around the top edge of a H4 supply area at 1232.9-1228.3 (positioned within the upper limits of the aforementioned daily supply). However, what is also interesting is the fact that the H4 AB=CD 161.8% ext. connects beautifully with the weekly resistance mentioned above at 1241.2.
Our suggestions: The area to watch at the moment can be seen between the H4 127.2%/161.8% extensions (yellow zone – 1241.7/1232.9). Be that as it may, we would not be comfortable entering short from here UNTIL a reasonably sized H4 bear candle takes form.
Levels to watch/live orders:
- Buys: Flat (stop loss: N/A).
- Sells: 1241.7/1232.9 ([wait for a H4 bear candle to form before looking to execute a trade] stop loss: ideally beyond the trigger candle)


