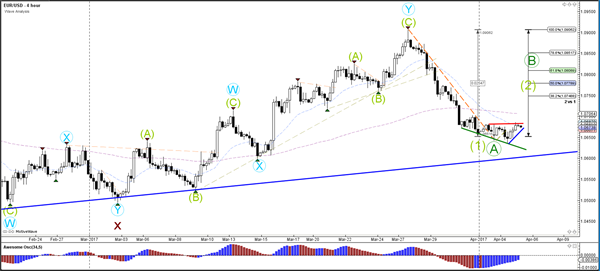
Currency pair EUR/USD
The EUR/USD is struggling to show momentum in either direction and has decided to move sideways. When looking at the divergence visible on the hourly chart, it seems more likely that a wave 2 or B retracement will occur but a break above resistance is needed to confirm.
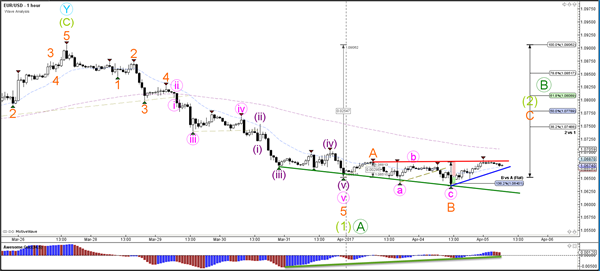
The EUR/USD 1 hour chart is showing a heavy double divergence between the bottoms of price and the oscillator (green lines). The downtrend has lasted 300 pips but could now be in serious danger of a retracement if price manages to break above resistance (red). The wave count could still be in a wave ABC (orange) because it did not break below the 138.2% Fibonacci level of wave B vs A (orange). A break below that level indicates a downtrend continuation whereas a break above resistance (red) could spark a wave C (orange).
Currency pair GBP/USD
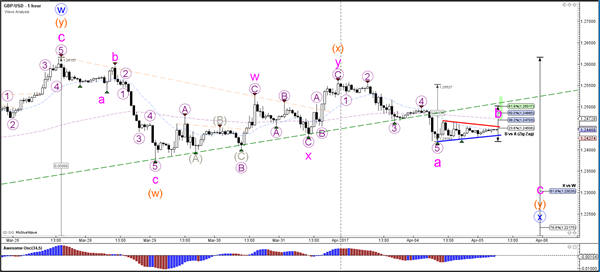
The GBP/USD broke below the support trend line (dotted green) and is now building a small contracting triangle (red/blue lines). A break above resistance (red) could see price challenge a higher resistance trend line (red). A break below support (blue) could see price challenge the 61.8% Fibonacci level of wave X vs W (blue).
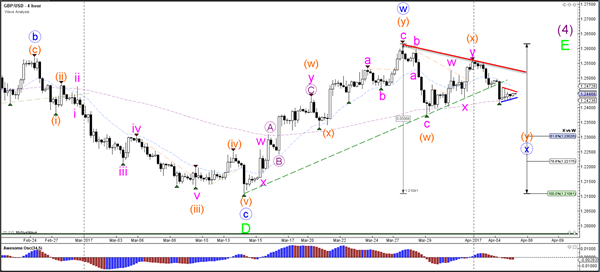
The GBP/USD could be building a larger ABC zigzag (pink) within wave X (blue). A bullish break above the trend line (red) could be short lived as price hits resistance Fibonacci levels of wave B vs A.
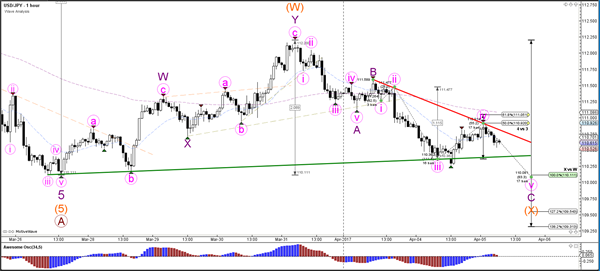
Currency pair USD/JPY
The USD/JPY challenged the support trend line (green) but did manage to break below it. USD/JPY could be in an expanded WXY (orange) of wave B (brown), which seems more likely if price manages to break above resistance (red). The alternative is that the wave B (brown) has already been completed (green B) and price is completing the bearish wave C (brown).
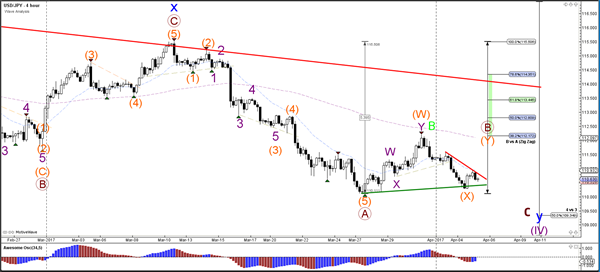
If the USD/JPY is part of a wave C (brown) then price could be building a 5 wave pattern (pink). Price should not retrace deeper than the 50% Fib of wave 4 vs 3 (pink) and a break above the 61.8% Fib and trend line (red) invalidates the 5 waves (pink).