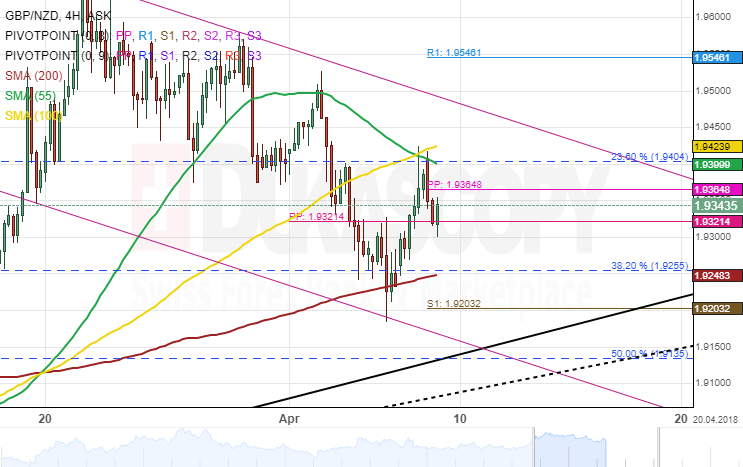
The British Pound continues to strengthen against the New Zealand Dollar. However, a new downtrend channel has been spotted and it is believed to be a corrective movement south as it can be observed on the chart.
After piercing both the 38.20% Fibonacci retracement level and the 200– hour simple moving average, the GBP/NZD exchange rate began to appreciate, nonetheless, a resistance cluster set by the 55– and 100– hour SMAs has restricted the pair from making any further gains. This retracement can be measured by connecting the low at 128.96 and the high at 132.27.
Technical indicators suggest that a short period of consolidation is likely during the following trading session.