
Key Highlights
- The British Pound declined heavily and broke the 1.3950 support area against the US Dollar.
- There is a short-term connecting bearish trend line forming with resistance at 1.3860 on the 4-hours chart of GBP/USD.
- The US Pending Home Sales in March 2018 increased 0.4%, less than the forecast of +0.9%.
- Today, the UK Manufacturing PMI for April 2018 will be released, which is forecasted to decline from 55.1 to 54.8.
GBPUSD Technical Analysis
The British Pound started a major downside move from well above 1.4350 against the US Dollar. The GBP/USD pair tumbled by more than 400 pips and traded towards the 1.3700 support.
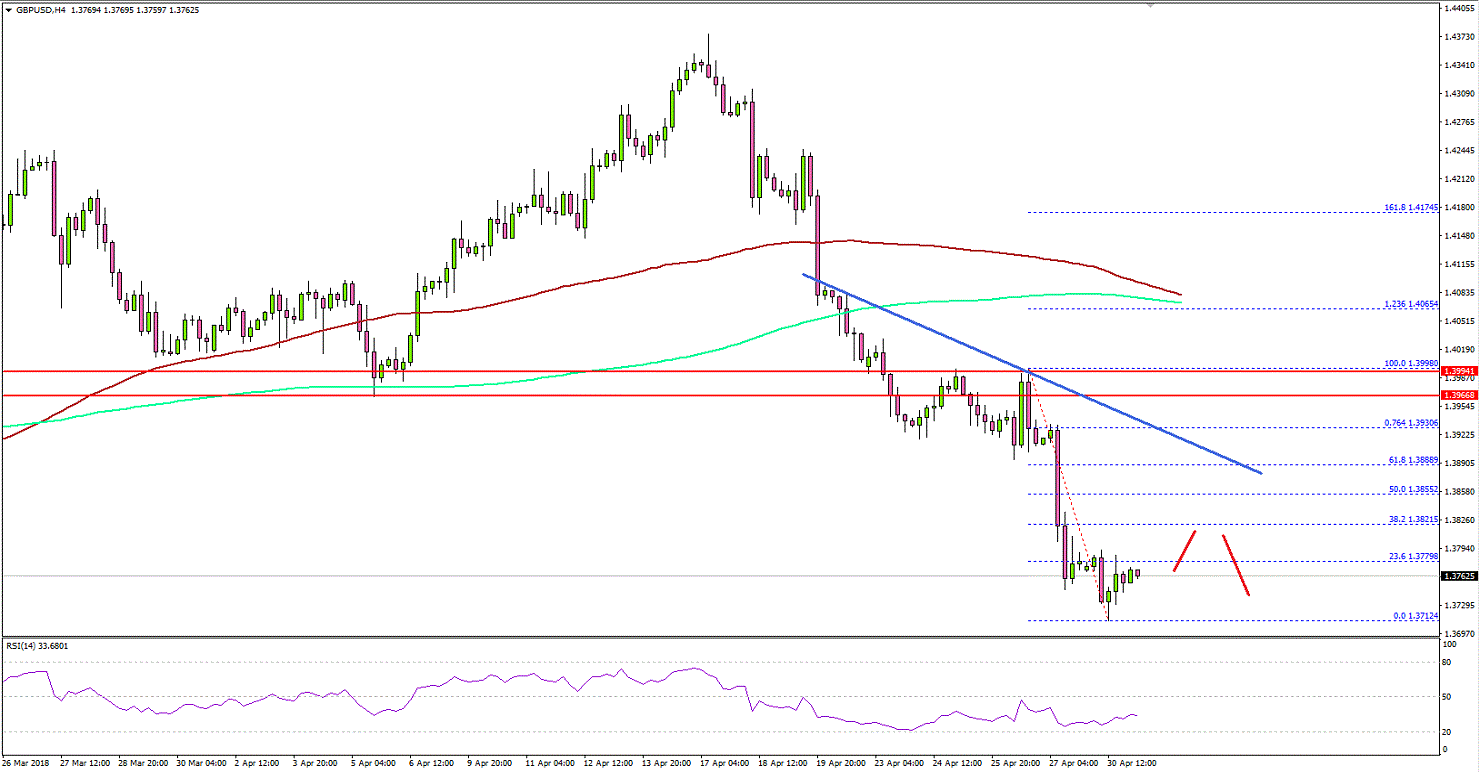
Looking at the 4-hours chart, the pair faced a lot of selling pressure and declined below a few important supports during the decline such as 1.4100 and 1.4000. The most important break was around the 1.3950 support, which pushed the pair into a bearish zone.
The pair is now trading well below the 100 (red) and 200 (green) simple moving averages (4-hour). A low was formed at 1.3712 recently before the pair started consolidating losses.
An initial resistance is around the 38.2% Fib retracement level of the last drop from the 1.3998 high to 1.3712 low. There is also a short-term connecting bearish trend line forming with resistance at 1.3860 on the same chart.
Therefore, any major upside correction is likely to face strong selling interest near 1.3850. On the downside, a break below the 1.3700 level may perhaps ignite further losses.
Recently, the US Pending Home Sales report for March 2018 was released by the National Association of Realtors. The market was looking for a rise of 0.9% in sales compared with the previous month.
However, the actual result was a bit on the lower side as there was an increase of 0.4% in sales in March 2018. There was a slight downside reaction in the US Dollar, but it remains supported.
Economic Releases to Watch Today
- UK Manufacturing PMI for April 2018 – Forecast 55.1, versus 54.8 previous.
- US ISM Manufacturing PMI for April 2018 – Forecast 59.3, versus 58.4 previous
- US Manufacturing PMI for April 2018 (Preliminary) – Forecast 56.5, versus 56.5 previous.
- Canadian Gross Domestic Product for Feb 2018 (MoM) – Forecast +0.3%, versus -0.1% previous.


