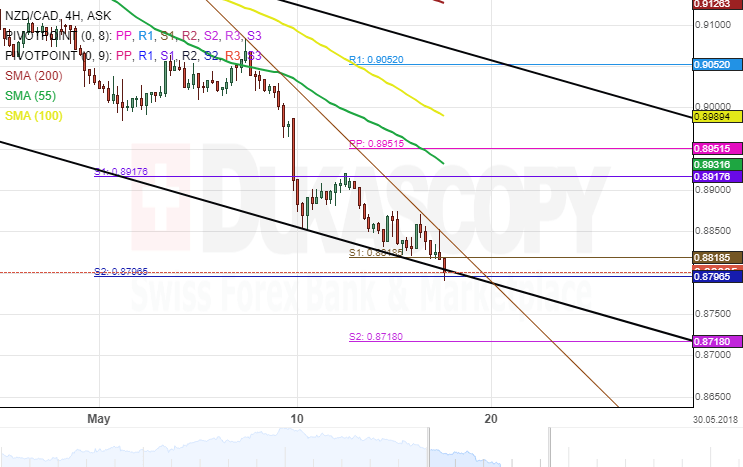
The movement for the NZD/CAD exchange rate has been constrained by a dominant descending channel for the past two months. This decline has led the Kiwi to a five-month low level.
Since May 8, bears dominance in the market over the currency pair has been significant. The pair is currently trading in a falling wedge. Furthermore, the 55– hour simple moving average has pressured the rate further south.
Technical indicators suggest another set of decline for the currency exchange rate during the following trading sessions. However, a brief reverse north from the weekly support level at 0.88 could be a possibility within this session.