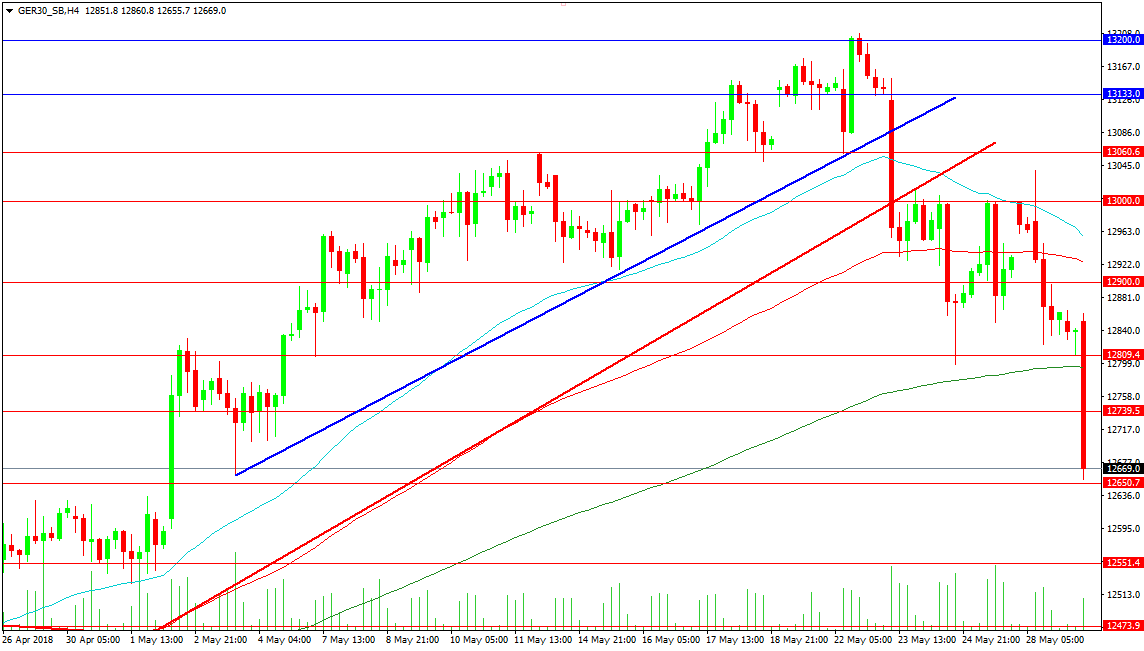
GER 30
The German Index has fallen further today after the turmoil in Italian politics sparks a risk off mood in Europe and further afield. The upward trend lines were broken last week on the 4 Hour chart with the red trend line breaking at the 13000.00 level which was then used as resistance. The price has fallen to the 12650.00 area at the time of writing with further decline likely to see support at 12550.00 and 12473.90. A move under these supports could result in a retest of 12400.00 as support which is the upper band of a zone that extends down to 12250.00. This zone contains the previous supportive trend line from October 2017 to January 2018 that the price broke at the beginning of February. A loss of this area could lead to a severe drop and bearish technical pattern triggers.
Should price manage to find a bottom relatively soon the 12800.00 area may present some difficulty for bulls. It contains the 200 period MA and the 12809.40 level, where price has found support the past week. A clearance of the zone could see a retest of 12900.00 and the 100 period MA at 12924.50 with the 50 period MA at 12956.70. A move back above 13000.00 would put bulls back on track to the 13200.00 level and the highs at 13600.00.
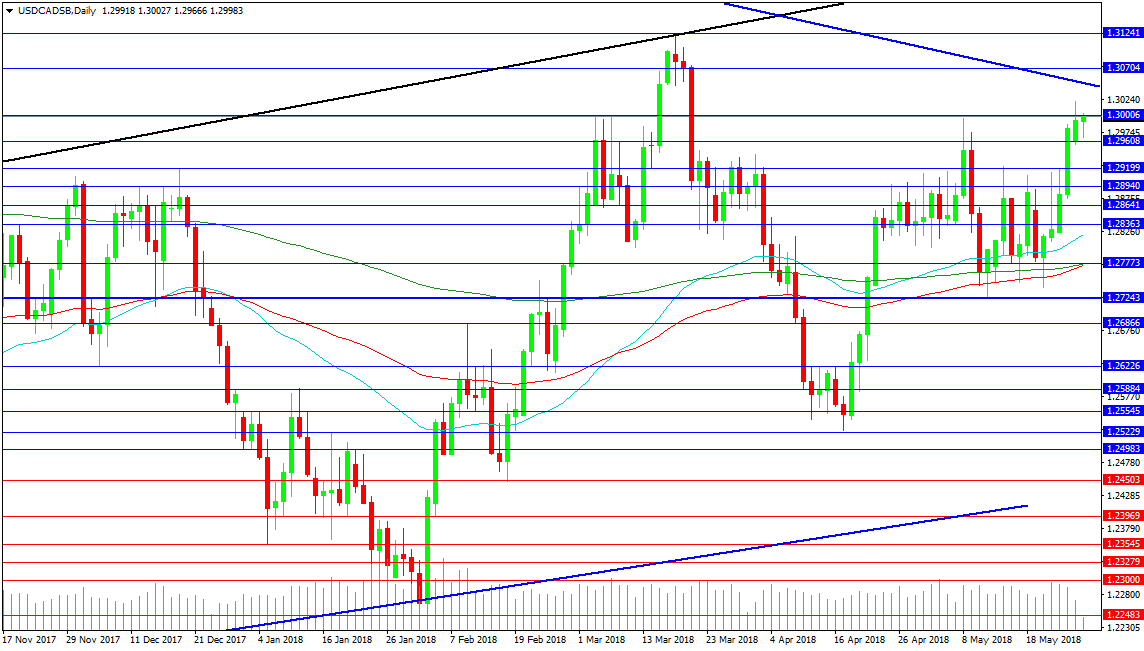
USDCAD
The USDCAD pair has pushed higher to the 1.30000 area after Oil price fell to the lowest levels in six weeks yesterday. The rally in the pair started on Tuesday when WTI Oil was at its high of $72.84 and the USDCAD pair broke above its DMAs as the Oil price fell. The 1.29200 level saw a temporary halt in the advance but news on Friday that Russia and Saudi Arabia would ease cuts and increase production sent the Oil price down 4% with a corresponding move in USDCAD to highs just under 1.30000. Should the Oil price continue to fall it is logical to expect this inverse correlation with USDCAD to continue and the trend line at 1.30450 to be retested. A move above this line which comes from the 2015 and 2017 highs could see a break out towards the recent high at 1.31240 followed by the 1.33000 area.
Support comes in at 1.29200 followed by the 1.28000 area and the low at 1.27250. A break under this level could see losses extend to 1.25300 and a retest of trend line support at 1.24400. This could result in a push down to 1.22480 followed by 1.22130 and 1.22000. This is unlikely given the fundamental macro environment.