
Gold finished the previous week in red territory and corrected to significantly lower grounds as it performed its widest weekly loss in March. Yet the price action so far in the current week seems to point to stabilization and even advancement for the Gold market. In this report we will be calling out the most important matters that are related to the gold market at the moment. In addition, Gold’s technical analysis will be presented giving at the same time our personal view on the current trend and the levels associated.
At the moment, the Gold market is keeping its eyes firm on the Ukrainian war with the situation possibly worsening. Military strikes continue to take place while the two sides have not agreed for a ceasefire so far. A few media reports see the war extending in the following weeks or months. The news in our opinion may invite some bullish tendencies for Gold which tends to appreciate when Geopolitical tensions escalate.
As noted in our previous reports, US bond yields continue to be carefully monitored by traders during the uncertainty presented currently. The US 10-year treasury yields reached 2.3% in the most recent sessions, holding their upward trend so far in the current year. Rising bond yields tend to signal investors are selling bonds in the expectation that interest rates will increase. Yesterday, Fed Chairman Powell signaled that a steep rate hike path is to follow by the Fed in the coming months which may have intensified bond yields upward movement even further. The Fed Chairman reported that inflationary pressures continued to be elevated and the Fed will take ‘necessary steps’ to address the issue implying that further and possibly larger rate hikes are on the way. Yet the question here is, how does this relate to the Gold market? Rate hikes are considered by analysts and traders as a sign that an economy is expanding at rapid levels and barriers need to be implemented to reduce the growth and limit consumer spending and lending. This notion has led the Treasury yields returning to their pre-pandemic levels which could make Gold, a non-yielding instrument with further storage costs attached to it, not so attractive.
On a similar note, the FOMC meeting that took place on the 16th of March may have failed to produce the expected volatility for the Gold market. Upon announcement of the 25-basis points rate hike, Gold dropped approximately $15 in the next 20 minutes yet rebounded and surged to close the daily session positive in the next hours. The buying momentum was extended to the next day and Gold has basically moved in a sideways motion since that event. Even though as noted the outcome of the event may have been already priced in by the market, after the interest rate announcement Gold’s downward trend formed in the days prior was interrupted. The Fed’s projections for the following years seem rather encouraging considering the gloomy global outlook taking place globally. According to the economic projections for the current and following years, stable unemployment and dropping inflation pressures could be providing some positivity to the market. Yet Gold’s usage as a safe haven could also be reduced since Indicators of economic activity and employment have continued to strengthen.
Finally, in the following days several economic releases from the US can be used as trading opportunities for Gold traders. On the 23rd of March, we get the February New Home Sales-Units and Federal Reserve Chair Jerome Powell’s speech at the Bank for International Settlements Innovation Summit. On the 24th of March we get the weekly Initial Jobless Claims figure along with the very important Flash Markit Manufacturing and Services PMI figures for March. On the 25th of March we get the University of Michigan Economic Sentiment Final reading while on the 29th of March we get the key Consumer Confidence figure for March.
Technical Analysis
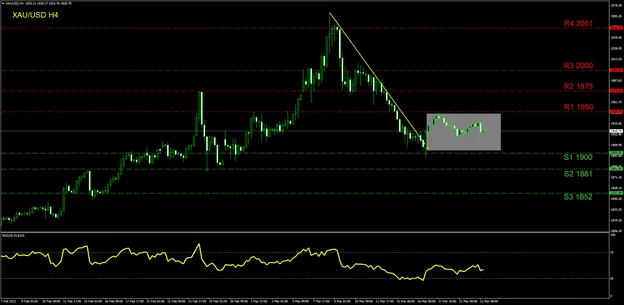
XAU/USD H4
Gold has moved outside the downwards trend that was used in the previous week and is now trading continuously within the (R1) 1950 resistance and the (S1) 1900 support range. In case a bullish trend is established, the (R1) 1950 resistance could be tested and possibly breached. If this trend is continued the (R2) 1975 level could be a test higher while a possible movement above could send the price action towards the (R3) 2000 line and may signal a change from the current sideways trend to a buying one. If the bulls are to completely dominate the scene during an extraordinary buying trend the (R4) 2051 which is the highest level reached so far 2022, can be revisited. The levels that we have noted in case a selloff is enacted are the (S1) 1900 support which is the lowest level tested so far in March. If the selling persists then we note the (S2) 1881 level which was last tested back in late February. At the end, the (S3) 1852 is our final support and was used in the first half of February. The RSI indicator below our chart remains below the 50 level but seems to mirror the sideways trend formed in the most recent sessions.


