
There is tentative sign of stabilization in US stock markets today. DOW initially extended the selloff to as low as 25226.16. The tamer than expected inflation reading just provided brief support to investor sentiments. However, as bond yields’ decline gathers momentum, stocks are back to life. At the time of writing, DOW is down just -0.01%, S&P 500 down 0.13% and NASDAQ is indeed up 0.56%. 10-year yield is down -0.060 at 3.165. 30 year yield is down -0.056 at 3.342. European markets didn’t enjoy the recovery, closing a little too early. FTSE closed down -1.94%, DAX down -1.48%, CAC down -1.92%.
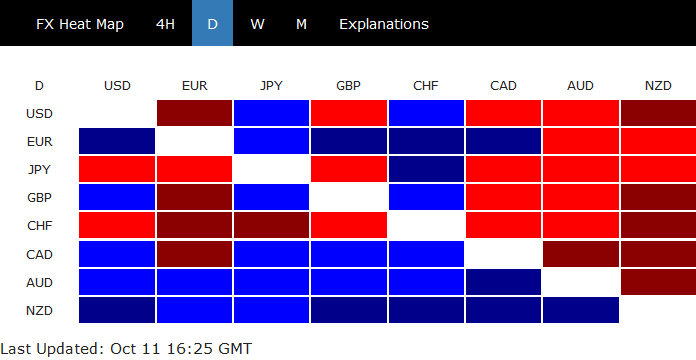
In the currency markets, Swiss Franc is undoubtedly the weakest one for now, followed by Yen and then Dollar. New Zealand, Australia and Canadian Dollar are the strongest ones.
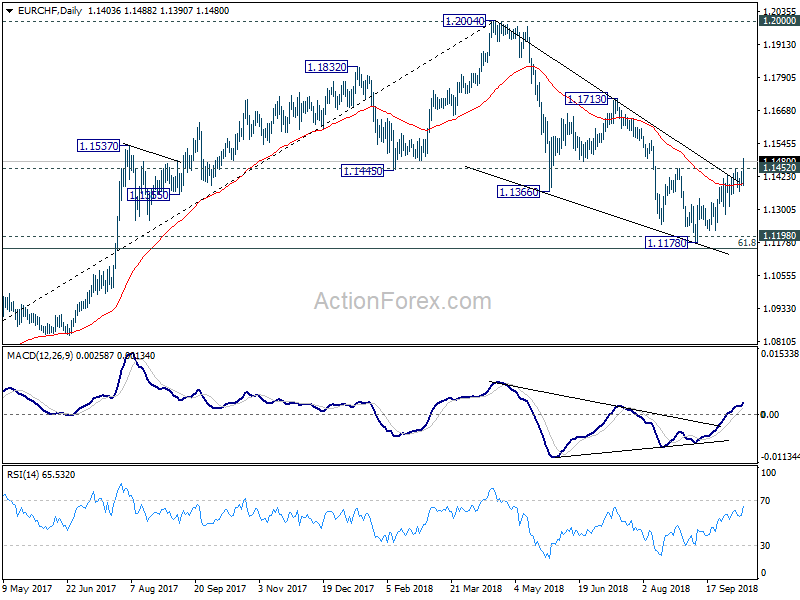
One development to note is that EUR/CHF has firmly taken out 1.1452 resistance decisively. The development should confirm bullish reversal after drawing support from 1.1154/98 key support zone. Further rise is now in favor back to 1.1713 resistance next.
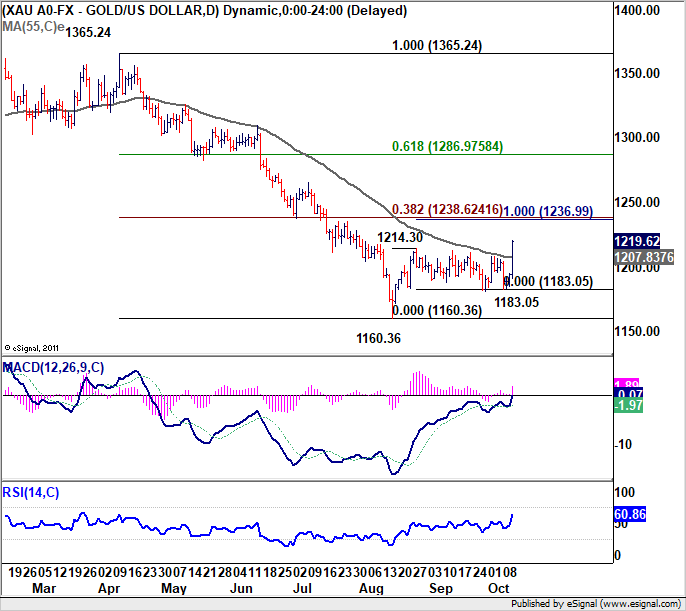
Another development is gold’s break of 1214 resistance Rebound from 1160.36 is extending. But we’d expect 1235.24/1236.99 cluster resistance zone (38.2% retracement of 1365.24 to 1160.36 at 1238.62, 100% projection of 1160.36 to 1214.30 from 1183.05 at 1236.99) to limit upside.


