
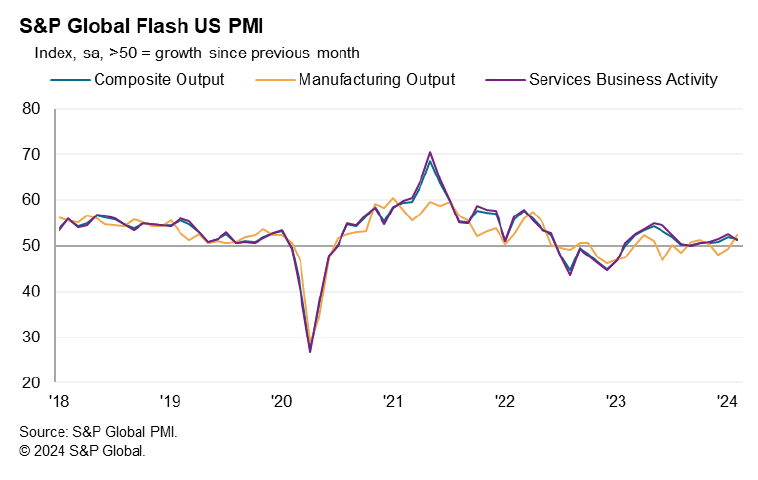
US PMI Manufacturing jumped from 51.5 to 50.7 in February, a 17-month high. PMI Services fell from 52.5 to 51.3. PMI Composite also fell from 52.0 to 51.4.
Chris Williamson, Chief Business Economist at S&P Global Market Intelligence said:
“The early PMI data for February indicate that the US economy continued to expand midway through the first quarter, pointing to annualized GDP growth in the region of 2%. Although service sector growth cooled slightly, manufacturing staged a welcome return to growth, with factory output growing at the fastest rate for ten months.
“Better weather conditions compared to January trumped shipping concerns, helping drive an overall improvement in supplier delivery times, which in turn facilitated higher factory production. Signs of inventory reduction policies becoming less widespread also helped boost production and sustain high levels of business confidence in the outlook for the year ahead among manufacturers.
“Service sector growth has slipped slightly, however, as has confidence in the year-ahead outlook among service providers, in part reflecting some pull back in the extent to which interest rates are expected to fall in 2024. It is nevertheless welcome news that both manufacturing and services are expanding again for the first time in three months.
“The sustained expansion is being accompanied by subdued price pressures. Although up slightly in February, the survey’s gauge of selling prices for goods and services continues to run at a level consistent with the Fed hitting its 2% inflation target, and a further fall in cost growth to the lowest since October 2020 hints at price pressures remaining subdued in the coming months.”


