


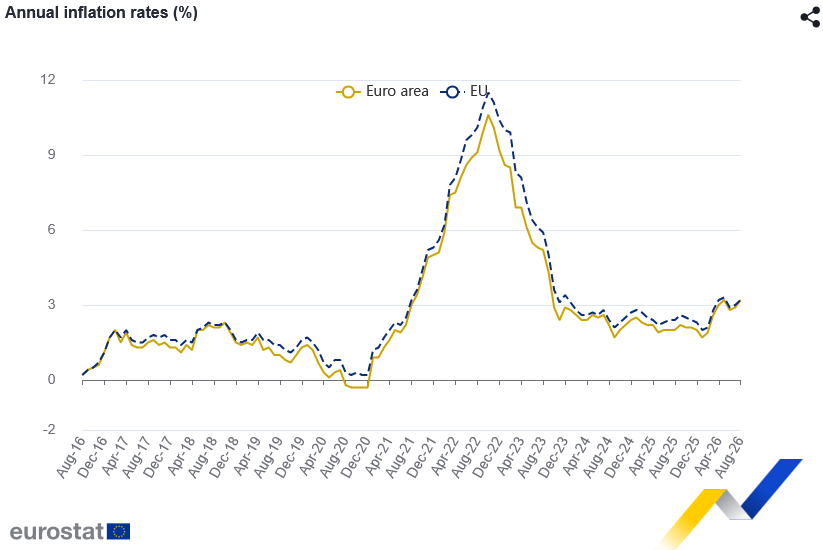
Eurozone annual CPI accelerated from 2.9% to 3.2% in August, while prices rose 0.4% m/m, according to Eurostat’s final estimate. The annual reading was revised below the preliminary estimate of 3.3%, while core inflation excluding energy, food, alcohol and tobacco eased from 2.5% to 2.4%. EU inflation also rose, from 3.0% to 3.2%.
The headline acceleration was overwhelmingly energy-driven. Energy inflation jumped from 10.3% to 14.3%, lifting its contribution to the headline rate from 0.94 to 1.29 percentage points. In contrast, services inflation slowed from 3.3% to 3.0%, and food, alcohol and tobacco inflation edged down from 1.2% to 1.1%. Non-energy industrial goods inflation increased from 0.9% to 1.2%, but contributed only 0.30 points. Inflation nevertheless became more geographically widespread, rising in 20 EU members, including increases from 2.8% to 2.9% in Germany, from 2.4% to 2.6% in France, from 2.9% to 3.2% in Italy and from 3.9% to 4.6% in Spain.
For the ECB, the composition argues against interpreting the rise above 3% as evidence of a broad resurgence in underlying inflation. Easing core and services rates suggest domestic pressure is moderating, while the headline increase reflects an external energy shock. However, the scale of the energy rise and its spread across member states increase the risk of second-round effects through wages, pricing decisions and inflation expectations. The policy significance will therefore depend less on the current headline rate than on whether higher energy costs begin reversing the improvement in services and core inflation.
Data summary
Headline readings
| Indicator | Actual | Expected / Flash | Previous |
|---|---|---|---|
| Eurozone HICP y/y | 3.2% | 3.3% | 2.9% |
| Eurozone core HICP y/y | 2.4% | 2.4% | 2.5% |
Additional readings
| Indicator | August | July |
|---|---|---|
| Eurozone HICP m/m | 0.4% | — |
| EU HICP y/y | 3.2% | 3.0% |
| Eurozone HICP excluding energy | 2.1% | 2.2% |
| Eurozone HICP excluding energy and unprocessed food | 2.1% | 2.2% |
Eurozone inflation components
| Component | August rate | July rate | August contribution |
|---|---|---|---|
| Energy | 14.3% | 10.3% | 1.29pp |
| Services | 3.0% | 3.3% | 1.43pp |
| Food, alcohol and tobacco | 1.1% | 1.2% | 0.22pp |
| Non-energy industrial goods | 1.2% | 0.9% | 0.30pp |
Selected national inflation rates
| Country | August | July |
|---|---|---|
| Germany | 2.9% | 2.8% |
| France | 2.6% | 2.4% |
| Italy | 3.2% | 2.9% |
| Spain | 4.6% | 3.9% |
Key takeaways
- Eurozone headline inflation accelerated from 2.9% to 3.2%, but was revised below the 3.3% flash estimate.
- Core inflation eased from 2.5% to 2.4%, matching expectations and pointing to softer underlying pressure.
- Energy drove the headline increase. Its annual rate jumped from 10.3% to 14.3%, contributing 1.29 percentage points to overall inflation.
- Services inflation slowed from 3.3% to 3.0%, an important counterweight to the energy shock.
- Inflation rose in 20 EU members, suggesting that the headline pressure was becoming geographically broader even as Eurozone core inflation eased.
- The data do not yet show a generalized second-round inflation cycle. For the ECB, the key question is whether higher energy costs begin feeding into services, wages and expectations.





