

Eurozone annual HICP inflation accelerated from 3.8% to 4.0% in October, confirming the flash estimate, according to Eurostat’s final release. Consumer prices rose 0.5% mom, while core inflation, excluding energy, food, alcohol and tobacco, edged up from 2.5% to 2.6% yoy, above the preliminary estimate of 2.5%. Headline inflation has nearly doubled from 2.1% a year earlier, although the latest increase was driven predominantly by energy. The upward revision to core inflation nevertheless indicates slightly firmer underlying price pressures than initially reported.
Energy remained the dominant driver of the headline acceleration, with annual price growth rising from a revised 19.0% to 21.0%, above the flash estimate of 20.8%. Its contribution to overall inflation increased from 1.72 to 1.89 percentage points, accounting for most of the rise in the headline rate. Other components also recorded more modest increases. Services inflation edged up from 3.2% to 3.3%, non-energy industrial goods inflation rose from 1.1% to 1.2%, and food, alcohol and tobacco inflation accelerated from 1.3% to 1.5%. Within the latter category, unprocessed food inflation increased from 4.0% to 4.6%, while processed food, alcohol and tobacco inflation remained unchanged at 0.4%.
Inflation developments varied considerably across member states. Italy recorded a sharp acceleration from 4.2% to 5.6%, while France’s rate increased from 3.4% to 3.7%. In contrast, Germany’s inflation eased from 3.3% to 2.9%, and Spain’s edged down from 5.0% to 4.9%. Across the EU, annual inflation rose in 16 member states, fell in nine and remained unchanged in two. The figures underline the uneven distribution of price pressures across Europe. While energy accounted for the bulk of October’s Eurozone inflation increase, the upward core revision and modest acceleration in services and goods prices suggest underlying inflation has not eased, even if its increase remains considerably smaller than the energy-driven headline rise.
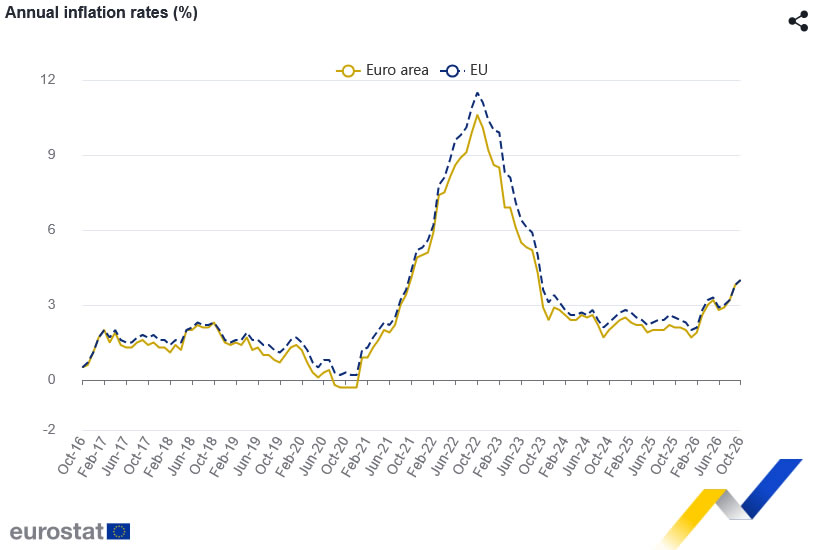
Data Summary — Eurozone CPI Final, October 2026
Headline and Core Inflation
| Indicator | Oct Final | Oct Flash | Sep |
|---|---|---|---|
| HICP Y/Y | 4.0% | 4.0% | 3.8% |
| Core HICP Y/Y | 2.6% | 2.5% | 2.5% |
| Indicator | Oct |
|---|---|
| HICP M/M | 0.5% |
Inflation Components — Annual Rates
| Component | Oct | Sep |
|---|---|---|
| Energy | 21.0% | 19.0% |
| Services | 3.3% | 3.2% |
| Non-Energy Industrial Goods | 1.2% | 1.1% |
| Food, Alcohol and Tobacco | 1.5% | 1.3% |
| Unprocessed Food | 4.6% | 4.0% |
Contributions to Annual HICP Inflation (Percentage Points)
| Component | Oct | Sep |
|---|---|---|
| Energy | 1.89 | 1.72 |
| Services | 1.55 | 1.52 |
| Non-Energy Industrial Goods | 0.30 | 0.29 |
| Food, Alcohol and Tobacco | 0.29 | 0.25 |
Selected Member States — Annual HICP
| Country | Oct | Sep |
|---|---|---|
| Germany | 2.9% | 3.3% |
| France | 3.7% | 3.4% |
| Italy | 5.6% | 4.2% |
| Spain | 4.9% | 5.0% |
Source: Eurostat, Euro Area Inflation, October 2026 Final, released November 18, 2026. September energy inflation and its contribution have been revised.
Key Takeaways
- Headline inflation confirmed, core revised higher: Eurozone HICP inflation accelerated from 3.8% to 4.0% yoy in October, confirming the flash estimate. Core inflation rose from 2.5% to 2.6%, above the preliminary reading of 2.5%.
- Energy accounts for most of the acceleration: Energy inflation climbed from a revised 19.0% to 21.0%, with its contribution rising from 1.72 to 1.89 percentage points. Services, industrial goods and food inflation also edged higher.
- National inflation trends diverge: Italy’s inflation jumped from 4.2% to 5.6%, while Germany’s eased from 3.3% to 2.9%. The figures highlight uneven price pressures across the Eurozone despite the common energy-driven headline increase.