
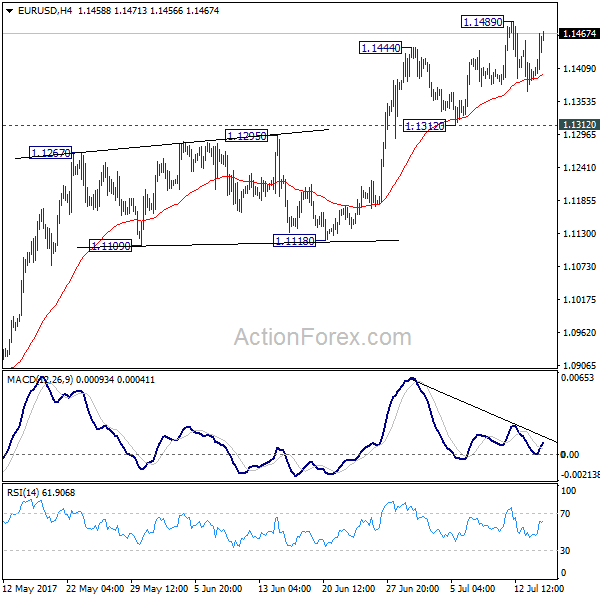
EUR/USD edged higher to 1.1489 last week but retreated since then. Initial bias stays neutral this week and more consolidation could be seen. But Break of 1.1312 will bring deeper fall to 55 day EMA (now at 1.1192). In that case, downside should be contained by 1.1118 support to bring rise resumption. On the upside, break of 1.1489 will extend recent rally from 1.0339 to 1.1615 key resistance next.
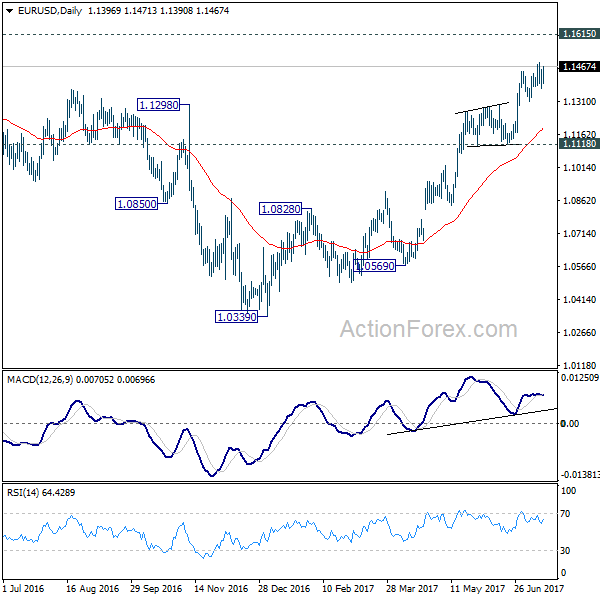
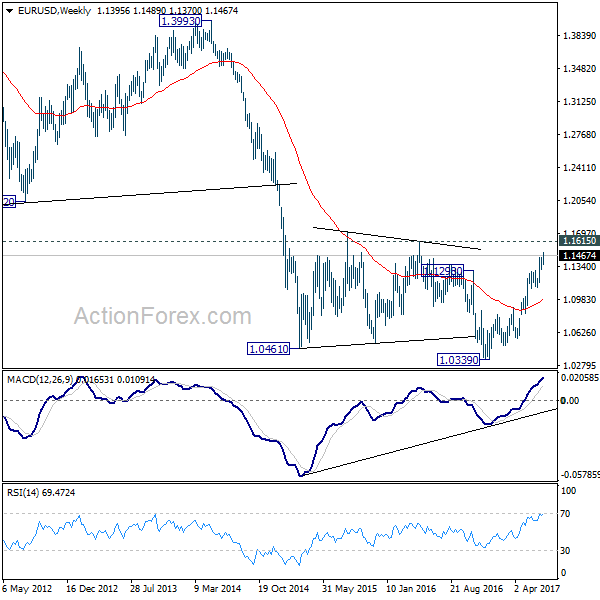
In the bigger picture, the firm break of 1.1298 resistance further affirm medium term reversal. That is, an important bottom was formed at 1.0339 on bullish convergence condition in weekly MACD. Further rise would be seen to 55 month EMA (now at 1.1763). Sustained break there will pave the way to 38.2% retracement of 1.6039 (2008 high) to 1.0339 (2017 low) at 1.2516 next. This will now remain the favored case as long as 1.1118 support holds.
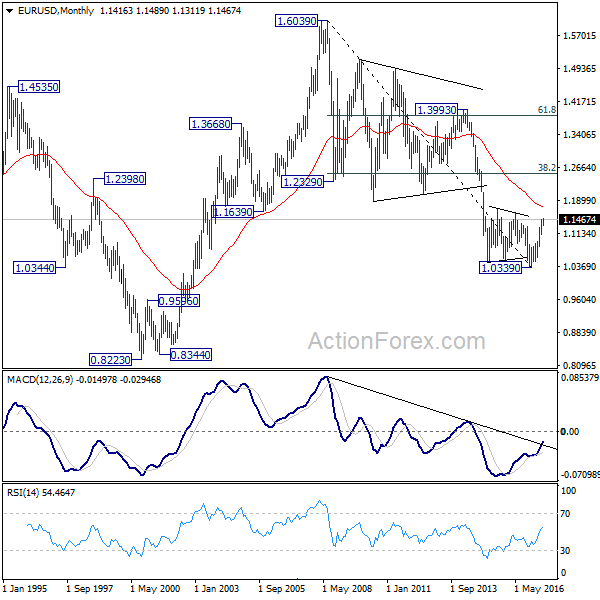
In the long term picture, 1.0339 is now seen as an important bottom as the down trend from 1.6039 (2008 high) could have completed. It’s still early to decide whether price action form 1.0339 is developing into a corrective or impulsive move. But in either case, further rally would be seen to 38.2% retracement of 1.6039 to 1.0339 at 1.2516


