
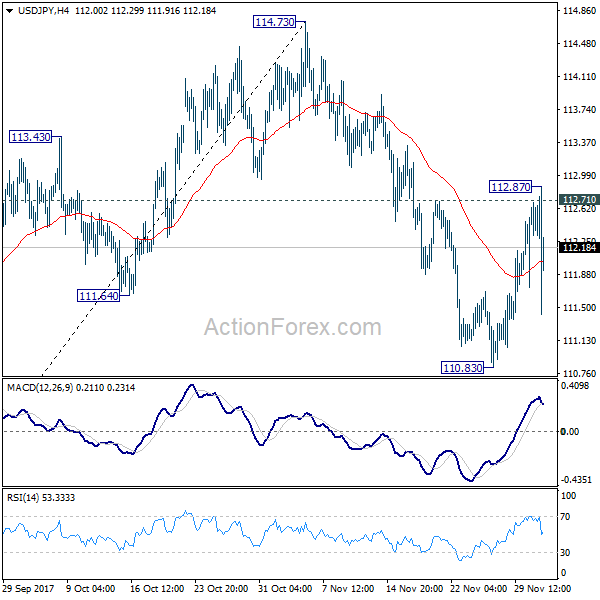
USD/JPY rebounded strongly to 112.87 last week but failed to sustain above 112.71 resistance a and dropped sharply since then. Initial bias is neutral this week first. On the upside, break of 112.87 should confirm completion of the pull back from 114.73 at 110.83. Intraday bias should then be turned back to the upside for retesting 114.73. On the downside, in case of another fall, we’d look for bottoming again below 61.8% retracement of 107.31 to 114.73 at 110.14.
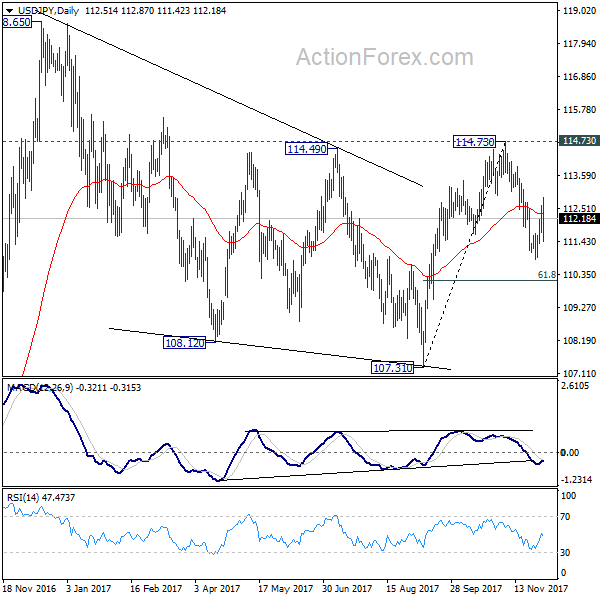
In the bigger picture, we’re holding on to the view that correction from 118.65 is completed a 107.31. And medium term rise from 98.97 (2016 low) is resuming. Sustained break of 114.73 should affirm our view and send USD/JPY through 118.65. However, break of 107.31 will dampen this will and extend the medium term fall back to 98.97 low.
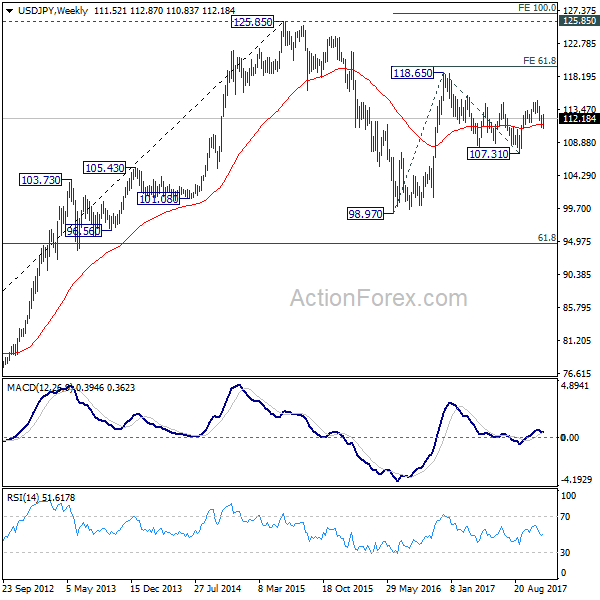
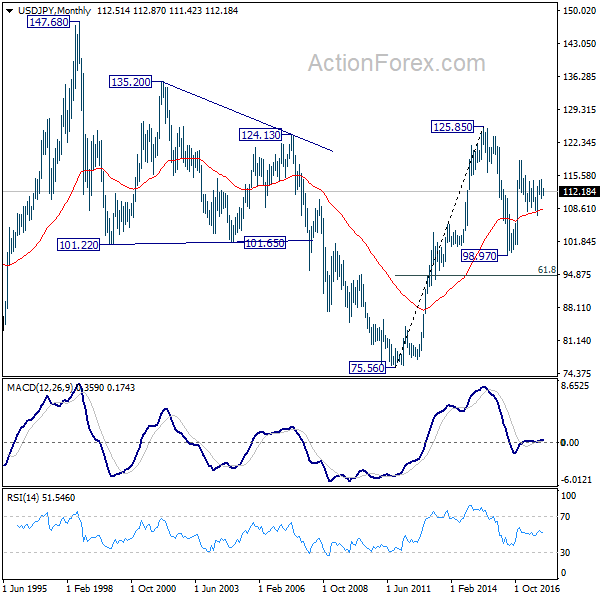
In the long term picture, the rise from 75.56 (2011 low) long term bottom to 125.85 top is viewed as an impulsive move, no change in this view. Price actions from 125.85 are seen as a corrective move which could still extend. In case of deeper fall, downside should be contained by 61.8% retracement of 75.56 to 125.85 at 94.77. Up trend from 75.56 is expected to resume at a later stage for above 135.20/147.68 resistance zone.


