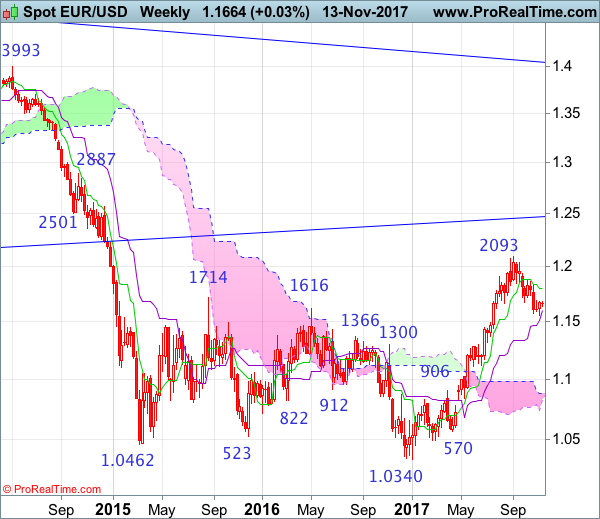
Weekly
• Last Candlesticks pattern: Shooting star
• Time of formation: 31 Jul 2017
• Trend bias: Near term up
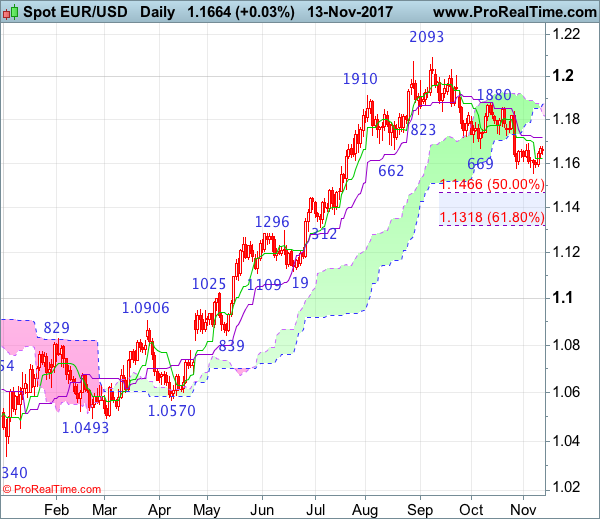
Daily
• Last Candlesticks pattern: Shooting star
• Time of formation: 2 Aug 2017
• Trend bias: Up
EUR/USD – 1.1674
As the single currency has rebounded after falling to 1.1554 (with a hammer candlestick reversal pattern on the daily chart), suggesting consolidation above this level would be seen and recovery to the Kijun-Sen (now at 1.1717) cannot be ruled out, however, reckon previous support at 1.1725 would limit upside and bring another decline later, below said support at 1.1554 would extend the fall from 1.2093 top to 1.1500 and later towards 1.1465-66 (50% Fibonacci retracement of 1.0839-1.2093) but reckon 1.1370 support would hold and price should stay above 1.1312-18 (previous support and 61.8% Fibonacci retracement).
On the upside, whilst an initial recovery to 1.1700 cannot be ruled out, reckon the Kijun-Sen (now at 1.1717) would limit upside and price should falter below 1.1725 (previous minor support), bring another decline to aforesaid downside targets. A daily close above previous support at 1.1725 would defer and suggest low is possibly formed instead, risk rebound to 1.1790-00, then test of resistance at 1.1837 but break there is needed to add credence to this view, bring another bounce to indicated previous resistance at 1.1880 first.
Recommendation: Sell at 1.1715 for 1.1515 with stop above 1.1815.
On the weekly chart, as euro found support at 1.1554 (just held above the Kijun-Sen) and has recovered, a white candlestick was formed last week, hence consolidation would be seen and recovery towards 1.1715-25 cannot be ruled out, however, reckon upside would be limited to 1.1750-55 and price should falter well below the Tenkan-Sen (now at 1.1795) and bring another retreat later, below said support at 1.1554 would extend the retreat from 1.2093 top for retracement of recent rise to 1.1500, then 1.1466 (50% Fibonacci retracement of 1.0839-1.2093) but reckon downside would be limited to 1.1400 and 1.1312-18 (previous support and 61.8% Fibonacci retracement) should hold, price should stay above previous minor resistance at 1.1296, bring rebound later.
On the upside, expect recovery to be limited to 1.1700 and renewed selling interest should emerge around (1.1715-25), bring another decline later. Above 1.1790-00 would risk test of indicated resistance at 1.1837 but only break of resistance at 1.1880 would shift risk back to the upside and suggest the pullback from 1.2093 top has ended, bring further gain to 1.1935-40, then towards 1.2035-40. Having said that, break there is needed to provide confirmation, bring retest of 1.2093.