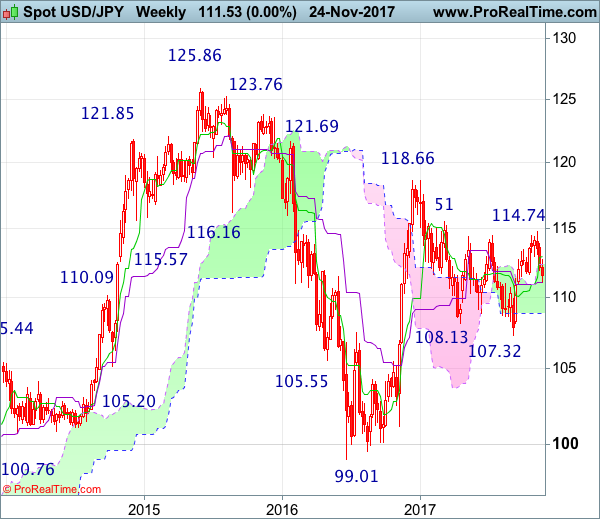
Weekly
• Last Candlesticks pattern: Dark cloud cover
• Time of formation: 10 Jul 2017
• Trend bias: Down
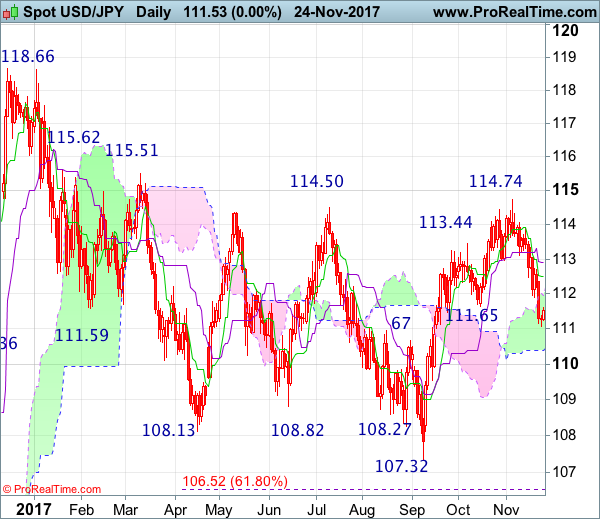
Daily
• Last Candlesticks pattern: Evening doji
• Time of formation: 7 Aug 2017
• Trend bias: Down
USD/JPY – 111.47
Although the greenback dropped to as low as 111.07 late last week, the subsequent recovery suggests consolidation above this level would be seen and corrective bounce to the Tenkan-Sen (now at 112.29) is likely, however, reckon upside would be limited to the Kijun-Sen (now at 112.91) and bring another decline later, below said support would add credence to our view that temporary top has been formed at 114.74 earlier and bearishness remains for the fall from there to extend weakness to the lower Kumo (now at 110.41), then towards 110.00, having said that, oversold condition would limit downside to 109.50-60 and price should stay well above 109.00-10.
On the upside, whilst initial recovery to 112.00, then test of the Tenkan-Sen (now at 112.29) cannot be ruled out, reckon the Kijun-Sen (now at 112.91) would attract renewed selling interest and bring another decline later. A daily close above the Kijun-Sen would suggest a temporary low is formed instead, bring a stronger rebound to 113.30-35 but still reckon upside would be limited to resistance at 113.91 and price should falter well below said recent high at 114.74, bring another retreat later.
Recommendation : Sell at 112.90 for 110.90 with stop above 113.90
On the weekly chart, as the greenback has remained under pressure after recent retreat from 114.47 top and broke below indicated support at 111.65, adding credence to our view that a temporary top has been formed there, hence consolidation with mild downside bias remains for weakness to the Kijun-Sen (now at 111.03), a sustained breach below there would confirm and bring retracement of the rise from 107.32 low to 109.50-60, then towards 109.00 which is likely to hold from here due to near term oversold condition.
On the upside, expect recovery to be limited to the upper Kumo (now at 112.32) and the Tenkan-Sen (now at 112.91) should hold and bring another decline later. A weekly close above the Tenkan-Sen would bring test of indicated resistance at 113.91 but only break there would revive bullishness and signal the retreat from 114.74 has ended instead, bring retest of this level. Once this resistance is penetrated, this would extend recent rise from 107.32 to 115.51-62 resistance area, break there would add credence to our view that early erratic decline from 118.66 has ended at 107.32, then headway to 116.50-60 and possibly 117.00-10 would follow.