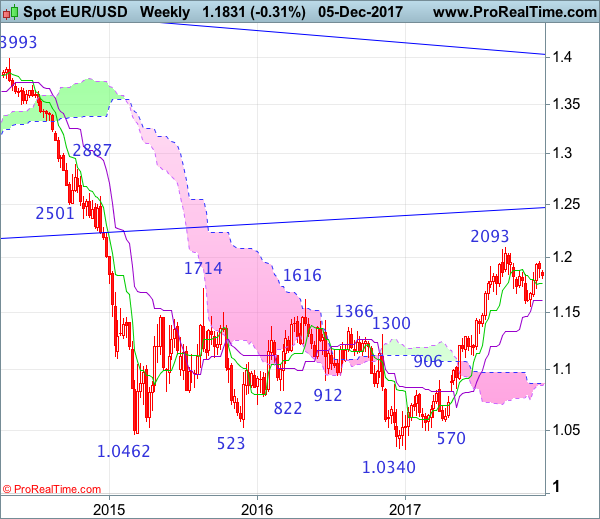
Weekly
• Last Candlesticks pattern: Shooting star
• Time of formation: 31 Jul 2017
• Trend bias: Near term up
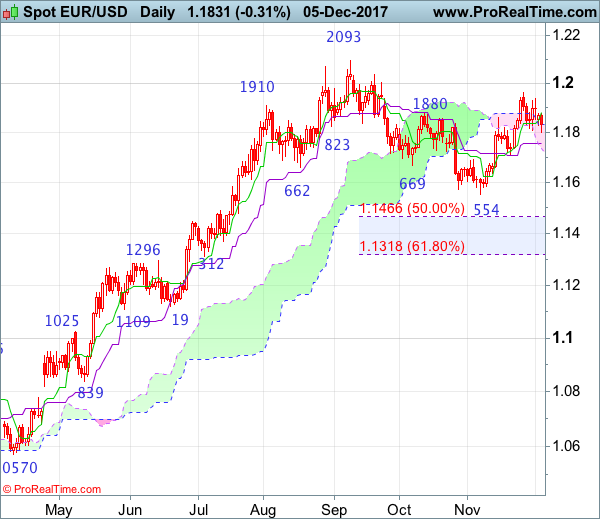
Daily
• Last Candlesticks pattern: Shooting star
• Time of formation: 2 Aug 2017
• Trend bias: Up
EUR/USD – 1.1817
Although the single currency rebounded to 1.1940, renewed selling interest emerged there and euro has slipped again, suggesting further consolidation below recent high of 1.1961 would be seen and test of the Kijun-Sen (now at 1.1758) cannot be ruled out, however, a daily close below support at 1.1713 is needed to signal the rebound from 1.1554 has ended, bring further fall to 1.1650-60, then towards 1.1600 but said support at 1.1554 should remain intact.
On the upside, whilst recovery to the Tenkan-Sen (now at 1.1881) cannot be ruled out, reckon upside would be limited to 1.1900 and bring another decline to aforesaid downside targets. Above said resistance at 1.1940 would risk retest of last week’s high at 1.1961 but only break there would signal the rise from 1.1554 is still in progress and extend gain to 1.2005. Looking ahead, above there would confirm recent upmove has resumed for retest of 1.2093, break there would extend the rise from 1.0340 low to 1.12150-55 first.
Recommendation: Sell at 1.1880 for 1.1680 with stop above 1.1980.
On the weekly chart, although euro rose to as high as 1.1961 early last week, the subsequent retreat together with the gap-down opening this week suggest consolidation below this level would be seen and test of the Tenkan-Sen (now at 1.1758) cannot be ruled out, however, a weekly close below support at 1.1713 is needed to signal the rebound from 1.1554 has ended, bring weakness to 1.1650-60, then towards said support at 1.1554 which is likely to hold from here. A drop below said support at 1.1554 would signal a temporary top has been formed at 1.2093, bring retracement of recent rise to 1.1500, then 1.1466 (50% Fibonacci retracement of 1.0839-1.2093) but reckon downside would be limited to 1.1400 and 1.1312-18 (previous support and 61.8% Fibonacci retracement) should hold, price should stay above previous minor resistance at 1.1296, bring another rebound.
On the upside, expect recovery to be limited to 1.1880-85 and resistance at 1.1940 should hold, bring another retreat. Above said resistance at 1.1961 would revive bullishness and signal early pullback from 1.2093 has ended at 1.1554, bring further gain to 1.2005, once this level is penetrated, this would confirm early rise from 1.0340 low has resumed for retest of 1.2093, above there would extend headway to 1.2150-55, then 1.2200-10 later.