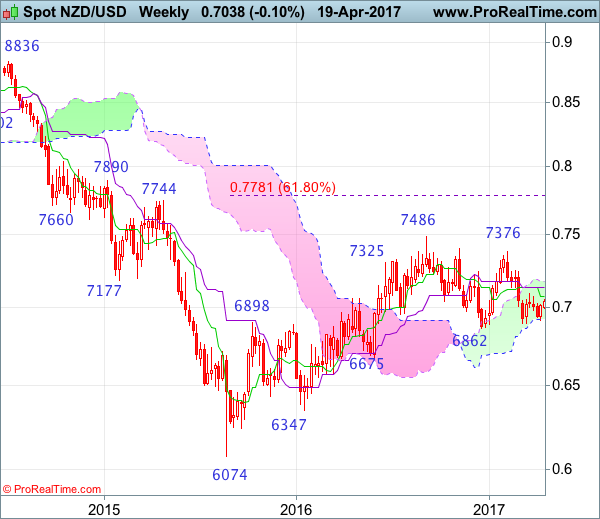
Weekly
• Last Candlesticks pattern: Shooting star
• Time of formation: 5 Sep 2016
• Trend bias: Down
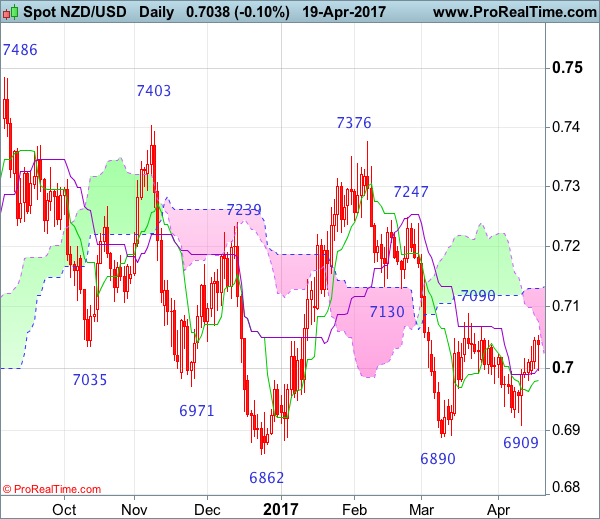
Daily
• Last Candlesticks pattern: Hammer
• Time of formation: 14 Mar 2017
• Trend bias: Near term up
NZD/USD – 0.6974
Kiwi found renewed buying interest at 0.6909 and has staged a strong rebound, retaining our view that further consolidation above recent low at 0.6890 would be seen and mild upside bias remains for test of indicated resistance at 0.7090 but break there is needed to signal another leg of rebound from 0.6890 low is underway to bring at least a retracement of recent decline from 0.7376 to the upper Kumo (now at 0.7131), however, break there is needed to retain bullishness and encourage for further subsequent rise to 0.7185-90 but resistance at 0.7247 should remain intact.
On the downside, whilst initial pullback to the Tenkan-Sen (now at 0.6981) cannot be ruled out, reckon downside would be limited to 0.6940-50 and bring another rebound later. Only a break of said support at 0.6890 would abort and revive bearishness for the fall from 0.7376 top to extend weakness to 0.6862, then towards 0.6775-80 (50% Fibonacci retracement of 0.6074-0.7486) but price should stay well above previous chart support at 0.6675.
Recommendation: Hold long at 0.6980 for 0.7180 with stop below 0.6940
On the weekly chart, as kiwi has rebounded after finding support at 0.6909 last week, retaining our near term bullishness for another bounce to 0.7090 resistance, break there would bring test of the Kijun-Sen (now at 0.7133), however, a weekly close above there is needed to add credence to our view that the fall from 0.7376 has ended at 0.6890 and encourage for further gain towards resistance at 0.7247. Having said that, as broad outlook remains consolidative, reckon upside would be limited to 0.7300-10 and price should falter below said resistance at 0.7376, bring retreat later.
On the downside, expect pullback to be limited to 0.6970-80 and bring another rebound. Only below said support at 0.6890 would abort and bring test of previous support at 0.6862, however, a breach of latter level is needed to retain bearishness and extend the erratic decline from 0.7486 top to 0.6780 (50% Fibonacci retracement of 0.6074-0.7486) and later towards previous chart support at 0.6675 which is likely to hold from here.