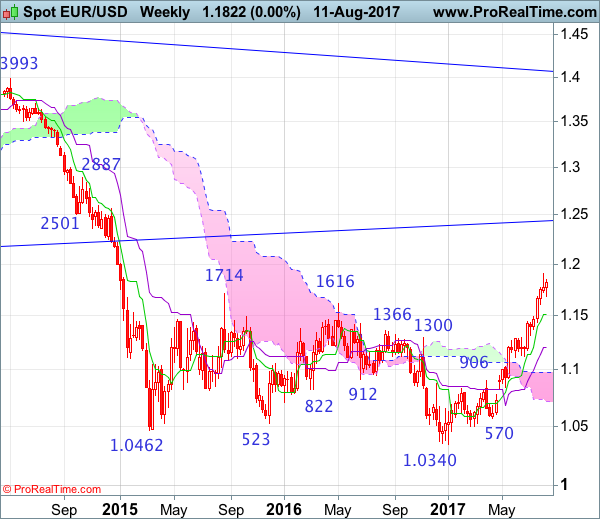
Weekly
• Last Candlesticks pattern: Shooting star
• Time of formation: 31 Jul 2017
• Trend bias: Near term up
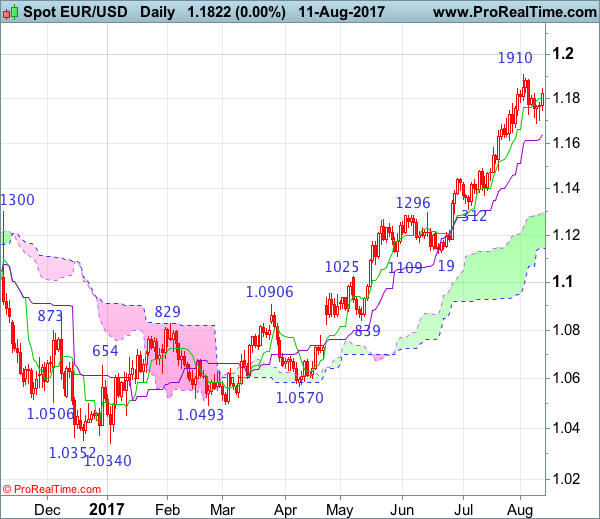
Daily
• Last Candlesticks pattern: Shooting star
• Time of formation: 2 Aug 2017
• Trend bias: Up
EUR/USD – 1.1800
Although the single currency found support at 1.1689 last week and has rebounded, as long as recent high at 1.1910 holds, further consolidation would take place and near term downside risk remains for another corrective fall, below said support at 1.1689 would bring retracement of recent rise to the Kijun-Sen (now at 1.1640), then towards 1.1590-00, however, reckon 1.1540-45 would contain correction and bring another rise later. Above said resistance at 1.1910 would signal recent upmove from 1.0340 low has resumed and extend headway to 1.1950, then psychological level at 1.2000, having said that, loss of upward momentum should prevent sharp move beyond 1.2165 and price should falter below 1.2220-30, bring retreat later.
On the downside, expect pullback to be limited to 1.1590-00 and bring another rise. Below 1.1540-45 would defer and risk test of 1.1490 (previous resistance turned support), a daily close below there would signal a temporary top is formed instead, bring retracement of recent rally to 1.1435, then 1.1390-00, however, still reckon downside would be limited to 1.1350 and price should stay above support at 1.1312.
Recommendation: Buy at 1.1590 for 1.1790 with stop below 1.1490.
On the weekly chart, although the single currency formed a shooting star on the weekly chart after retreating from recent high of 1.1910, as a black candlestick did not materialize last week, suggesting minor consolidation would be seen, however, as long as said resistance holds, prospect of another corrective fall remains, below 1.1689 support would bring minor correction to 1.1613 support but break there is needed to suggest a temporary top is formed, bring retracement of recent upmove to the Tenkan-Sen (now at 1.1515) and later towards 1.1435, having said that ,downside should be limited to 1.1370 and support at 1.1312 should remain intact, bring rebound later.
On the upside, expect recovery to be limited to said resistance at 1.1910 and bring another retreat later. A break above said recent high at 1.1910 would signal the major rise from 1.0340 low is still in progress and may extend gain to 1.1950, then 1.1200, however, weakening of near term upward momentum would prevent sharp move beyond 1.2160-70 and reckon 1.2220-30 would hold, price should falter below 1.2300-10, bring another retreat later.
‘