Weekly
• Last Candlesticks pattern: Dark cloud cover
• Time of formation: 10 Jul 2017
• Trend bias: Down
Daily
• Last Candlesticks pattern: Evening doji
• Time of formation: 7 Aug 2017
• Trend bias: Down
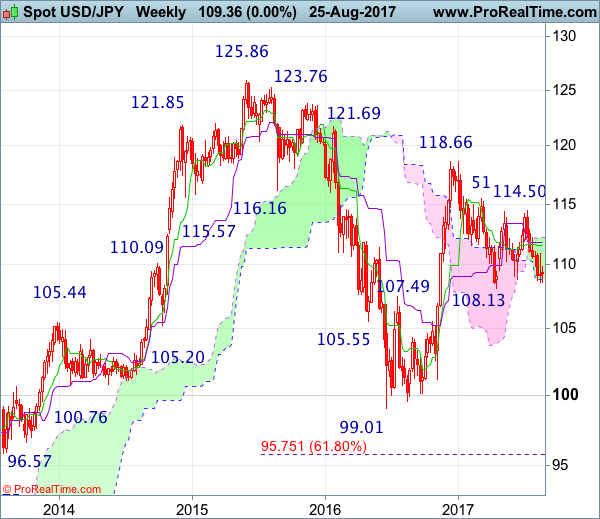
USD/JPY – 109.12
Although the greenback has retreated after meeting resistance at 109.85, reckon downside would be limited to 108.80-85 and risk of another corrective bounce remains, above said resistance at 109.85 would bring recovery to 110.10-15 and then test of the Kijun-Sen (now at 110.40) but resistance at 110.95 should remain intact and bring another decline later. Below 108.60-63 would signal the rebound from 108.13 has ended, bring retest of this level. Once this recent low is penetrated, this would extend early decline from 118.66 top to 107.50, then towards 106.50-55 (61.8% Fibonacci retracement of 99.01-118.66), having said that, near term oversold condition should prevent sharp fall below there and reckon previous resistance at 105.53 would hold from here.
On the upside, whilst initial recovery to the Tenkan-Sen (now at 109.78) cannot be ruled out, reckon upside would be limited to the Kijun-Sen (now at 110.40) and resistance at 110.95 should attract renewed selling interest and bring another decline later. Above the lower Kumo (now at 111.66) would suggest the fall from 114.50 has ended instead, risk a stronger rebound to resistance at 112.20 but reckon upside would be limited to 112.40-45 and price should falter well below 113.00, bring another selloff later..
Recommendation : Sell at 110.55 for 109.00 with stop above 111.55.

On the weekly chart, the greenback traded within a relatively tight range last week as traders were in a wait-and-see mode, however, as long as minor support at 108.60-63 holds, risk of another corrective bounce cannot be ruled out, above 109.85 would bring recovery to 110.40-50, however, resistance at 110.95 should cap upside and bring another decline later. Below said support at 108.60-63 would extend the fall from 114.50 to previous support at 108.13 (2017 low), however, the pair needs to penetrate this level to confirm early fall from 118.66 top has resumed and extend decline to 117.40-50, then 117.00 but downside should be limited to 106.50-55 (61.8% Fibonacci retracement of 99.01-118.66) and previous resistance at 105.53 would turn into support, price should stay above 105.00, bring rebound later.
On the upside, although initial recovery to 109.85, then 110.40-50 cannot be ruled out, reckon resistance at 111.05 would limit upside and bring another decline later. Above the Tenkan-Sen (now at 111.55) would risk test of the Kijun-Sen (now at 111.82) but still reckon resistance at 112.20 would limit upside and bring another decline. A weekly close above resistance at 112.20 would suggest first leg of decline from 114.50 has ended instead, risk a stronger rebound to 112.90-00 but still reckon upside would be limited to 113.55-60 and price should falter well below resistance at 114.50, bring another decline later.