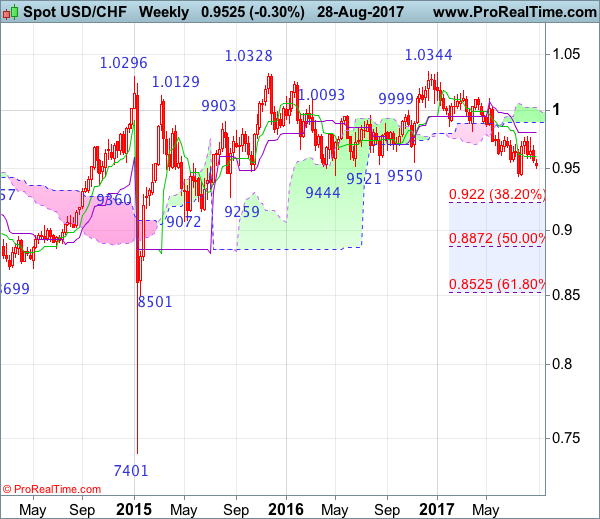
Weekly
• Last Candlesticks pattern: Shooting star
• Time of formation: 7 Mar 2017
• Trend bias: Sideways
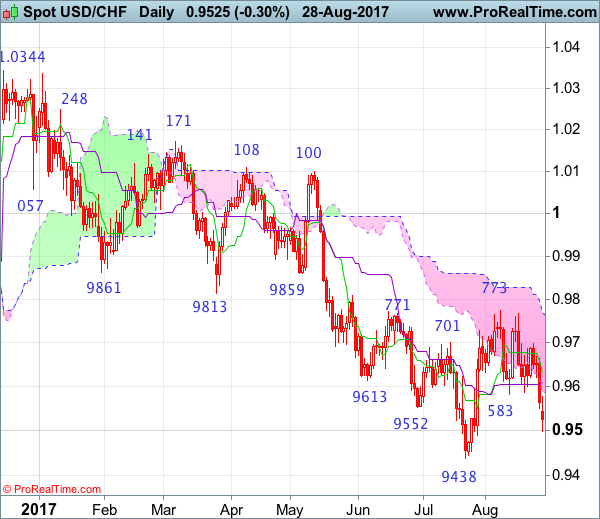
Daily
• Last Candlesticks pattern: Morning star
• Time of formation: 9 May 2017
• Trend bias: Near term up
USD/CHF – 0.9468
As the greenback has remained under pressure after breaking below indicated previous support at 0.9583, adding credence to our bearish view that the erratic decline from 0.9773 is still in progress, hence test of another previous support at 0.9438 would be seen, break there would signal early fall from 1.0344 (2016 high) has resumed and extend weakness to 0.9390-00, then towards 0.9330-35, having said that, near term oversold condition should prevent sharp fall below previous support at 0.9259 and reckon 0.9220 (38.2% Fibonacci retracement of entire rise from 0.7401-1.0344) would hold, risk from there is seen for a rebound to take place later.
On the upside, whilst recovery to 0.9530-40 cannot be ruled out, said previous support at 0.9583 should turn into resistance and limit dollar’s upside and bring another decline to aforesaid downside targets. Above 0.9620 would defer and risk a stronger rebound to 0.9663 and possibly test of resistance at 0.9698, however, upside should still be limited and price should falter below said resistance at 0.9773, bring another selloff next month.
Recommendation: Sell at 0.9520 for 0.9320 with stop above 0.9620
On the weekly chart, the greenback opened lower this week after breaking below previous support at 0.9583, suggesting the erratic decline from 1.0344 top has resumed and break of another previous support at 0.9438 would confirm and extend the aforesaid fall for further weakness to 0.9350, then towards previous support at 0.9259, however, near term oversold condition should prevent sharp fall below 0.9220 (38.2% Fibonacci retracement of 0.7401-1.0344) and reckon 0.9150 would hold from here, risk from there is seen for a rebound later.
On the upside, expect recovery to be limited to 0.9530-40 and said previous support at 0.9583 should turn into resistance and limit upside. A weekly close above the Tenkan-Sen (now at 0.9606) would defer and risk a stronger recovery to 0.9698 resistance, however, still reckon upside would be limited and resistance at 0.9773 should remain intact, bring another decline. Only a break of the Kijun-Sen (now at 0.9805) would abort and signal a temporary low is formed instead, bring a stronger rebound to the lower Kumo (now at 0.9894) but upside should be limited to the upper Kumo (now at 1.0023), price should falter well below resistance at 1.0100.