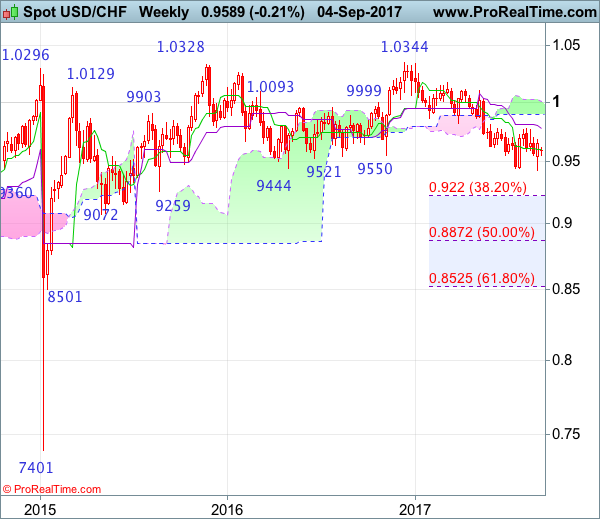
Weekly
• Last Candlesticks pattern: Shooting star
• Time of formation: 7 Mar 2017
• Trend bias: Sideways
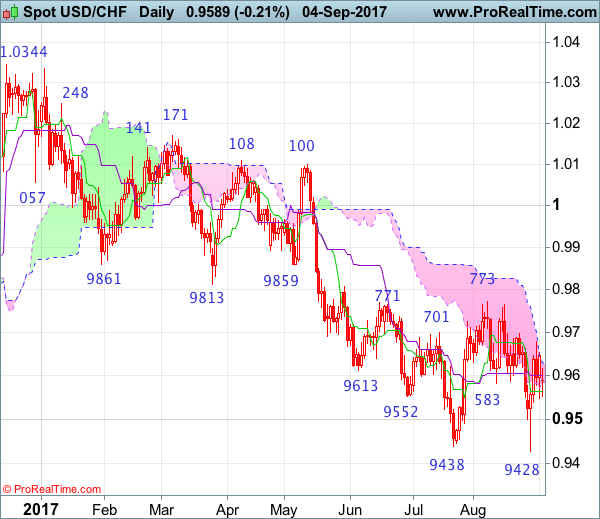
Daily
• Last Candlesticks pattern: Morning star
• Time of formation: 9 May 2017
• Trend bias: Near term up
USD/CHF – 0.9566
Despite last week’s brief fall to 0.9428, lack of follow through selling on break of previous support at 0.9438 and the subsequent stronger-than-expected rebound suggest a temporary low has possibly been formed there and consolidation with mild upside bias is seen, above resistance at 0.9680 would add credence to this view, bring test of 0.9698-99 resistance but break there is needed to provide confirmation, bring retracement of recent decline to previous resistance at 0.9773 which is likely to hold on first testing.
On the downside, whilst initial pullback to 0.9500-10 cannot be ruled out, reckon downside out be limited and said support at 0.9428 (last week’s low) should remain intact, bring another rebound later. Only a drop below 0.9428 would revive bearishness and signal early fall from 1.0344 (2016 high) has resumed and extend weakness to 0.9390-00, then towards 0.9330-35, having said that, oversold condition should prevent sharp fall below previous support at 0.9259 and reckon 0.9220 (38.2% Fibonacci retracement of entire rise from 0.7401-1.0344) would hold, risk from there is seen for another rebound to take place later.
Recommendation: Stand aside for this week.
On the weekly chart, although the greenback broke below previous support at 0.9438, lack of follow through selling and the subsequent bounce from 0.9428 formed a white candlestick with a long low shadow, suggesting a consolidation above this level would be seen and another bounce to 0.9698-99 resistance cannot be ruled out, however, break of resistance at 0.9773 (also current level of the Kijun-Sen) is needed to add credence to this view, bring retracement of recent decline to 0.9805-10, then test of the lower Kumo (now at 0.9894) but upside should be limited to the upper Kumo (now at 1.0001), price should falter well below resistance at 1.0100.
On the downside, expect pullback to be limited to 0.9500-10 and bring another rebound to aforesaid upside targets. Only a break of said support at 0.9428 would signal the erratic decline from 1.0344 top has resumed and bring further weakness to 0.9350, then towards previous support at 0.9259, however, oversold condition should prevent sharp fall below 0.9220 (38.2% Fibonacci retracement of 0.7401-1.0344) and reckon 0.9150 would hold from here, risk from there is seen for a rebound later.