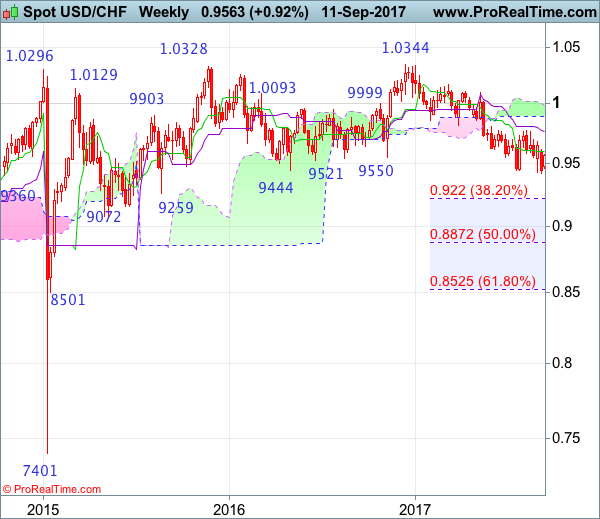
Weekly
• Last Candlesticks pattern: Shooting star
• Time of formation: 7 Mar 2017
• Trend bias: Sideways
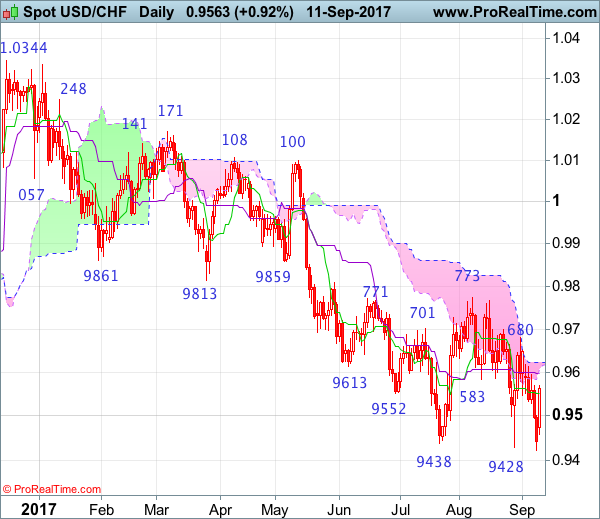
Daily
• Last Candlesticks pattern: Morning star
• Time of formation: 9 May 2017
• Trend bias: Near term up
USD/CHF – 0.9548
Although the greenback broke below previous support at 0.9428, lack of follow through selling and the subsequent rebound from last week’s low of 0.9421 suggest consolidation above this level would be seen and initial upside risk is for corrective bounce to the Kijun-Sen (now at 0.9597 but reckon the upper Kumo (now at 0.9623) would limit upside and bring another decline later. Below 0.9455-60 would bring a retest of said support at 0.9421, however, break there is needed to confirm recent decline from 1.0344 (2016 top) has resumed and extend weakness to 0.9390-00, then towards 0.9330-35, having said that, oversold condition should prevent sharp fall below previous support at 0.9259 and reckon 0.9220 (38.2% Fibonacci retracement of entire rise from 0.7401-1.0344) would hold.
On the upside, whilst recovery to the Kijun-Sen (now at 0.9597) cannot be ruled out, reckon the upper Kumo (now at 0.9623) would limit upside and bring another decline. Only a daily close above indicated resistance at 0.9680 would signal low has been formed instead, b bring further subsequent gain to 0.9698-99 resistance but price should falter well below another previous resistance at 0.9773.
Recommendation: Sell dollar at 0.9640 for 0.9400 with stop above 0.9740.
On the weekly chart, although the greenback fell briefly below previous support at 0.9428, the subsequent bounce from 0.9421 suggests consolidation above this level would be seen and corrective bounce to the Tenkan-Sen (now at 0.9597) cannot be ruled out, however, reckon upside would be limited to 0.9660-66 and bring another decline later. Below said support at 0.9421 would signal the decline from 1.0344 top is still in progress and may extend weakness to 0.9350, then towards previous support at 0.9259, however, oversold condition should prevent sharp fall below 0.9220 (38.2% Fibonacci retracement of 0.7401-1.0344) and reckon 0.9150 would hold from here, risk from there is seen for a rebound later.
On the upside, expect recovery to be limited to the Tenkan-Sen (now at 0.9597) and resistance at 0.9680 should remain intact, bring another decline later. A break of this level would risk test of 0.9765-73 (current level of the Kijun-Sen and previous resistance), however, only a sustained breach above this level would signal low is formed instead, bring a stronger rebound for retracement of recent decline to 0.9805-10, then test of the lower Kumo (now at 0.9894) but upside should be limited to the upper Kumo (now at 0.9982), price should falter well below resistance at 1.0100.