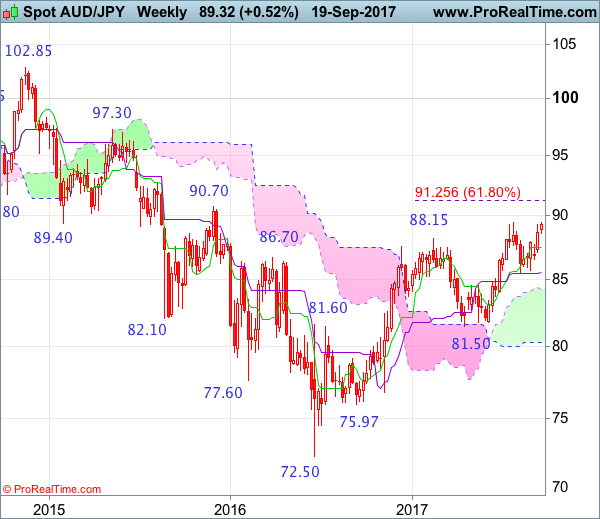
Weekly
• Last Candlesticks pattern: Shooting star
• Time of formation: 13 Mar 2017
• Trend bias: Down
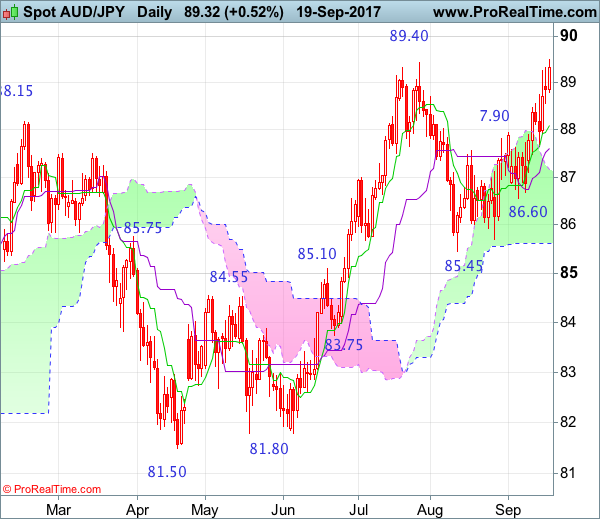
Daily
• Last Candlesticks pattern: Bearish engulfing pattern
• Time of formation: 16 Feb 2017
• Trend bias: Near term down
AUD/JPY – 89.05
As aussie has maintained a firm undertone after recent rally, suggesting a test of this year’s high at 89.40 would be seen, however, break there is needed to confirm medium term erratic upmove from 72.50 low (formed back in 2016) has resumed and extend gain to psychological resistance at 90.00, then test of previous resistance at 90.70 but near term overbought condition should limit upside to 91.00 and reckon 91.50-60 would hold, price should falter below 92.00, bring correction later.
On the downside, whilst pullback to 88.50-55 cannot be ruled out, reckon the Tenkan-Sen (now at 88.00) would limit downside and bring another rise later. A drop below the Kijun-Sen (now at 87.52) would defer and suggest a temporary top is possibly formed, bring weakness to 87.00 and possibly test of previous support at 86.60, however, a daily close below latter level is needed to add credence to this view, bring retracement of recent rise to 86.30-35 and possibly towards 86.00, having said that, support at 85.70 should remain intact, bring rebound later.
Recommendation: Buy again at 88.10 for 90.10 with stop below 87.10
On the weekly chart, aussie has staged a strong rebound after holding above support at 85.45, suggesting the erratic rise from 72.50 has possibly resumed and retest of 89.40 (this year’s high) would be seen, however, break there is needed to add credence to this view and extend gain to psychological resistance at 90.00, then test of previous resistance at 90.70 but overbought condition should limit upside to 91.50-60 and price should falter below another previous chart resistance at 92.70, bring correction later.
On the downside, expect pullback to be limited to 88.00-10 and bring further rise to aforesaid upside targets. A drop below the Tenkan-Sen (now at 87.44) would defer and risk weakness to 87.00, then towards 86.60 support, however, downside should be limited to 86.00 and said support at 85.45 should remain intact, bring another rise later. Only a drop below 85.45 support (this would also penetrate the Kijun-Sen) would signal upmove is not ready to resume yet and risk correction o recenter rise to 84.95-00, then test of the upper Kumo (now at 84.23) but reckon previous support at 83.75 would limit downside and price should stay above support at 82.55-60, bring rebound later.