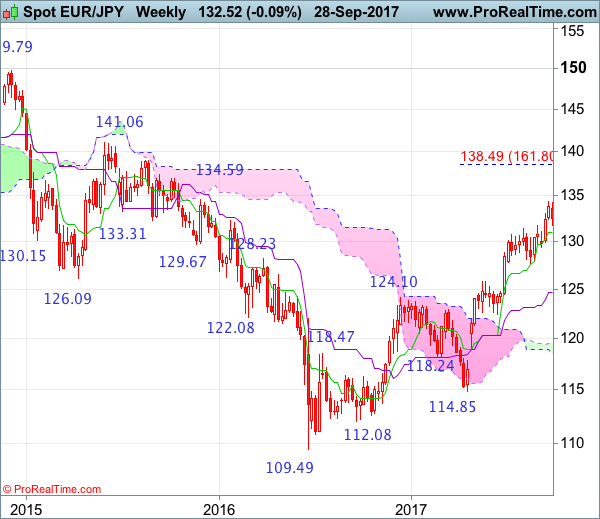
Weekly
• Last Candlesticks pattern: Window
• Time of formation: 24 April 2017
• Trend bias: Up
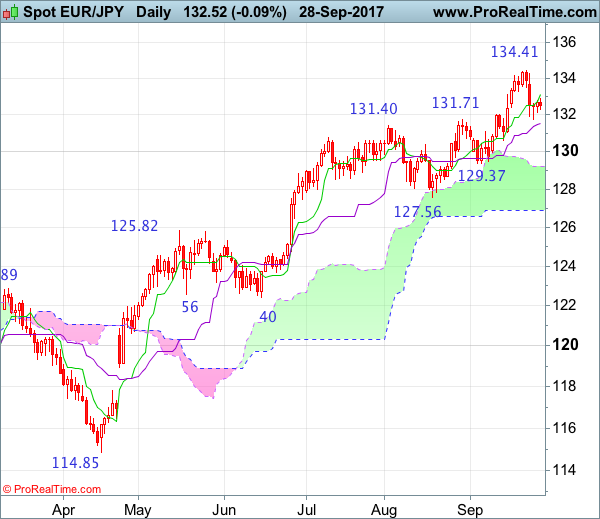
Daily
• Last Candlesticks pattern: Hammer
• Time of formation: 18 May 2017
• Trend bias: Up
EUR/JPY – 132.73
Although the single currency extended recent rise to as high as 134.41 late last week, lack of follow through buying and the subsequent retreat suggests 1-2 weeks of consolidation below this level would be seen, hence near term downside risk is for test of the Kijun-Sen (now at 131.54), however, a daily close below there is needed to signal a temporary top is possibly formed, bring retracement of recent rise to previous support at 130.62 and then towards psychological level at 130.00 but price should stay well above another previous support at 129.37, bring rebound later.
On the upside, whilst recovery to the Tenkan-Sen (now at 133.08) cannot be ruled out, reckon upside would be limited to 133.50-60 and 134.00 should hold, bring another retreat later. Only a break of said resistance at 134.41 would revive bullishness and signal recent upmove is still in progress and may extend further gain to 135.00, however, overbought condition should limit upside to 136.00-10 and reckon 136.90-00 would hold from here, price should falter well below 138.45-50 (1.618 times extension of 109.49-124.10 measuring from 114.85), risk from there has increased for a much-needed correction to take place later.
Recommendation: Exit long entered at 132.50 and stand aside for now.
On the weekly chart, despite last week’s rise to 134.41, the subsequent retreat suggests minor consolidation below this level would be seen and below 131.75 support would bring test of the Tenkan-Sen (now at 130.99) but a drop below this level is needed to suggest a temporary top is possibly formed, bring weakness to 129.95-00, however, only a break below 129.37 support would add credence to this view and signal retracement of recent upmove has commenced, hence downside risk is for further weakness to 128.90-00, then towards 128.00-10 but previous support at 127.56 should remain intact.
On the upside, expect recovery to be limited to 133.60-65 and price should falter below said resistance at 134.41, bring retreat later. A break of said resistance would signal recent upmove from 109.49 (2016 low) has once again resumed and extend gain to 135.00, then 136.00-10, however, reckon upside would be limited and 136.95-00 should hold, price should fatter below 138.45-50 (1.618 times extension of 109.49-124.10 measuring from 114.85), bring retreat later.