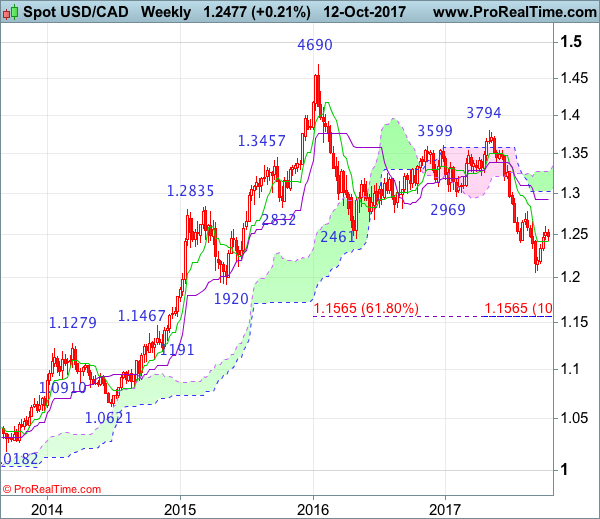
Weekly
• Last Candlesticks pattern: Shooting doji
• Time of formation: 01 May 2017
• Trend bias: Sideways
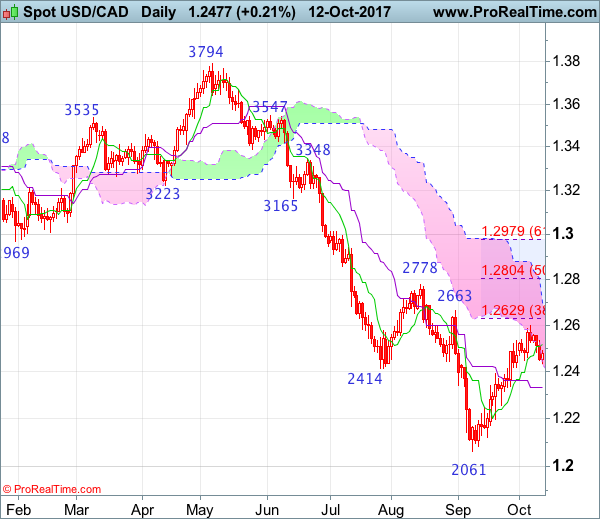
Daily
• Last Candlesticks pattern: Bearish engulfing
• Time of formation: 5 May 2017
• Trend bias: Down
USD/CAD – 1.2477
Although the greenback extended near term rise from 1.2061 low to 1.2599 last week, the subsequent retreat suggests consolidation below this level would be seen and pullback to 1.2400-10 is likely, however, reckon 1.2335-40 would contain downside and bring another rise later, above said resistance at 1.2599 would extend the aforesaid rise for retracement of early decline to 1.2620-25, then towards resistance at 1.2663, having said that, the upper Kumo (now at 1.2701) should limit upside an price should falter well below resistance at 1.2778, bring another decline later.
On the downside, whilst initial pullback to 1.2400 and then 1.2340-50 cannot be ruled out, reckon the Kijun-Sen (now at 1.2330) would limit downside and bring another rise later. Only a daily close below support at 1.2254 would abort and signal the rebound from 1.2061 has ended instead, bring weakness to 1.2198, break there would add credence to this view and extend weakness to 1.2121. Having said that, break there is needed to retain bearishness and bring further fall towards said recent low at 1.2061. Looking ahead, below 1.2061would extend downtrend to psychological level at 1.2000, having said that, loss of momentum should prevent sharp fall below 1.1920-25 (61.8% projection) and 1.1900 should hold.
Recommendation: Turn long at 1.2325 for 1.2525 with stop below 1.2225
On the weekly chart, although the greenback edged higher to 1.2599 last week, lack of follow through buying and the subsequent retreat look set to form a black candlestick this week, suggesting consolidation below said resistance would be seen and below the Tenkan-Sen (now at 1.2420) would bring weakness towards 1.2310-15, however, downside should be limited to 1.2230-40 and bring another rise later. Above said resistance at 1.2599 would signal the rebound from 1.2061 low is still in progress for retracement of recent decline to previous resistance at 1.2663, then 1.2700-10, having said that, price should falter below previous resistance at 1.2778, bring another decline later in Q4.
On the downside, expect pullback to be limited to 1.2310-15 and 1.2280-85 should hold, bring another rise later to aforesaid retracement targets. Below 1.2121 support would abort and signal the rebound from last month’s low at 1.2061 has ended, bring retest o this level later. A drop below 1.2061 would confirm decline from 1.3794 top has resumed and extend weakness towards psychological support at 1.2000, however, reckon downside would be limited to 1.1920-25 (61.8% projection of 1.3794-1.2414 measuring from 1.2778) and reckon 1.1840-50 would hold from here, price should stay above 1.1750-60, bring rebound later.