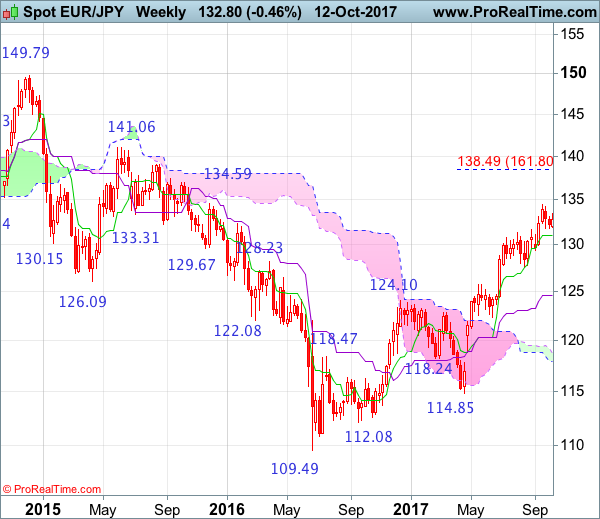
Weekly
• Last Candlesticks pattern: Window
• Time of formation: 24 April 2017
• Trend bias: Up
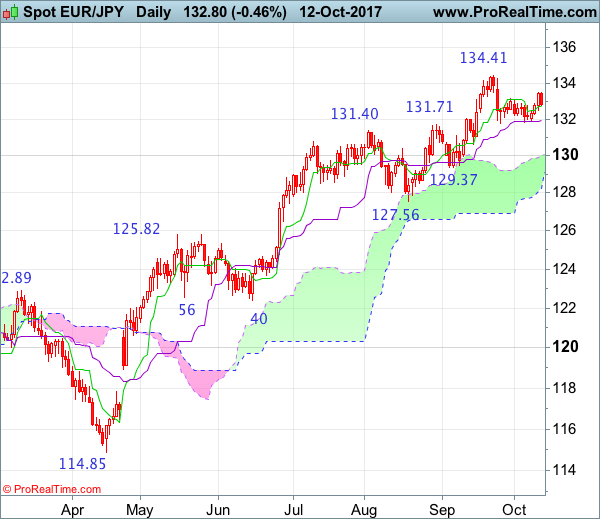
Daily
• Last Candlesticks pattern: Hammer
• Time of formation: 18 May 2017
• Trend bias: Up
EUR/JPY – 132.81
Although the single currency continued finding support just above indicated level at 131.75 and has rebounded this week, as euro met resistance at 133.50 and has retreated again yesterday, suggesting further sideways consolidation would take place and another retreat to 132.45 then 132.00 cannot be ruled out, however, only break of said strong support at 131.75 would revive bearishness and signal another leg of corrective decline from 134.41 (last month’s high) is underway for retracement of recent upmove to 131.00, then previous support at 130.62, having said that, reckon psychological level at 130.00 would limit downside and price should stay well above another previous support at 129.37, bring rebound later.
On the upside, whilst recovery to 133.00 cannot be ruled out, said resistance at 133.50 should cap upside and bring another retreat later. Only a break of said resistance at 134.41 would revive bullishness and signal recent upmove is still in progress for further gain to 135.00, however, near term overbought condition should limit upside to 136.00-10 and reckon 136.90-00 would hold from here, price should falter well below 138.45-50 (1.618 times extension of 109.49-124.10 measuring from 114.85), risk from there has increased for a much-needed correction to take place later.
Recommendation: Stand aside for this week.
On the weekly chart, euro’s retreat after last month’s rise to 134.41 has retained our view that minor consolidation below this level would be seen and below 131.75 support would bring test of the Tenkan-Sen (now at 130.99) but a drop below this level is needed to suggest a temporary top has possibly been formed, bring weakness to 129.95-00, however, only a break below 129.37 support would add credence to this view and signal retracement of recent upmove has commenced, hence further weakness to 128.90-00, then towards 128.00-10 would follow but previous support at 127.56 should remain intact.
On the upside, expect recovery to be limited to 133.50-60 and price should falter below said resistance at 134.41, bring retreat later. A break of said resistance would signal recent upmove from 109.49 (2016 low) has once again resumed and extend gain to 135.00, then 136.00-10, however, reckon upside would be limited and 136.95-00 should hold, price should fatter below 138.45-50 (1.618 times extension of 109.49-124.10 measuring from 114.85), bring retreat later.