
Weekly
• Last Candlesticks pattern: Dark cloud cover
• Time of formation: 10 Jul 2017
• Trend bias: Down
Daily
• Last Candlesticks pattern: Evening doji
• Time of formation: 7 Aug 2017
• Trend bias: Down
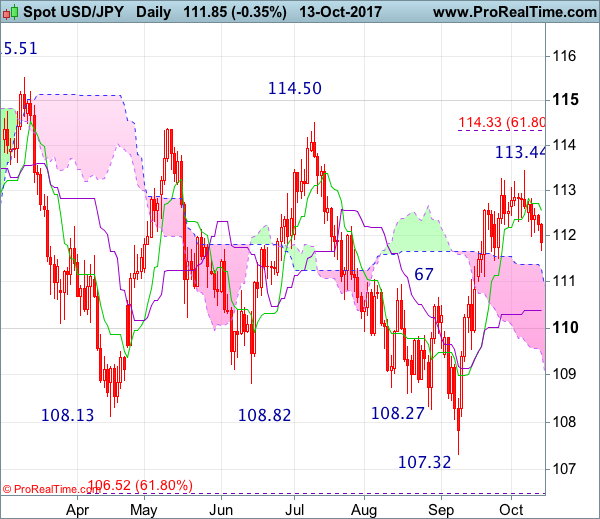
USD/JPY – 111.85
The greenback only recovered to 112.83 before retreating again (missed our short entry at 113.10), adding credence to our view that a temporary top has possibly been formed at 113.44 earlier this month and consolidation with mild downside bias remains for test of support at 111.47, however, break there is needed to provide confirmation, bring retracement of recent rise to 111.10-15, having said that, reckon downside would be limited to the Kijun-Sen (now at 110.38) and 110.00 should hold, price should stay well above previous support at 109.55, bring rebound later.
On the upside, whilst recovery to 112.25-30 is likely, reckon the Tenkan-Sen (now at 112.57) would limit upside and resistance at 112.83 should hold, bring another retreat later. A daily close above 112.83 would bring retest of 113.44 but break there is needed to signal the rise from 107.32 low has resumed for correction of recent entire decline from 118.66, then gain to 114.00 and possibly towards 114.30-35 (61.8% Fibonacci retracement of 118.66-107.32) would follow, however, loss of upward momentum should prevent sharp move beyond resistance at 114.50 and price should falter well below 115.00.
Recommendation : Sell at 112.70 for 110.70 with stop above 113.70
On the weekly chart, after forming a doji star at 113.44, last week black candlestick adds credence to our view that a minor top is possibly formed there and consolidation with mild downside bias remains for weakness to support at 111.47, then test of the Kijun-Sen (now at 110.91), however, only a weekly close below there would confirm and bring retracement of the rise from 107.32 to the Tenkan-Sen (now at 110.38) and then 109.90-95 but still reckon support at 109.55 would contain downside and bring another rise later.
On the upside, expect recovery to be limited to 112.80-85 and bring another retreat. Above said resistance at 113.44 would extend the aforesaid rise from 107.32 to 114.00, then 114.30-35 (61.8% Fibonacci retracement) but resistance at 114.50 should limit upside and psychological level at 115.00 should hold from here, bring retreat later.


