Weekly
• Last Candlesticks pattern: Shooting star
• Time of formation: 31 Jul 2017
• Trend bias: Near term up
Daily
• Last Candlesticks pattern: Shooting star
• Time of formation: 2 Aug 2017
• Trend bias: Up
EUR/USD – 1.1800
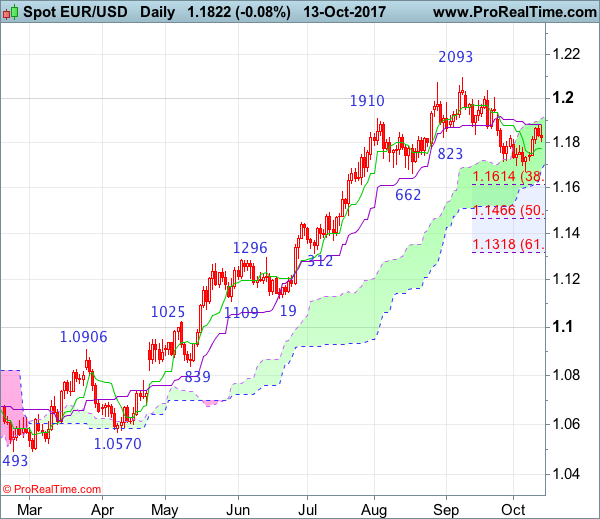
The single currency found good support at 1.1659 earlier this month and has staged a strong rebound, adding credence to our view that the fall from 1.2093 has formed a temporary low there and consolidation with mild upside bias is seen for test of 1.1875-80 (current level of the Kijun-Sen and last week’s high), however, break there is needed to retain bullishness and extend the rise from 1.1669 low to 1.1935-40, having said that, as broad outlook remains consolidative, reckon indicated resistance at 1.2005 would limit upside and price should falter below 1.2035, bring another retreat later.
On the downside, although initial pullback to the Tenkan-Sen (now at 1.1775) cannot be ruled out, reckon 1.1755-60 would hold and bring another rebound later. Only a drop below indicated support at 1.1662-69 would abort and signal the corrective decline from 1.2093 top is still in progress for retracement of early upmove to 1.1595-00, break there would bring subsequent fall to 1.1550, then towards 1.1500, having said that, previous support at 1.1479 should limit downside and 1.1466 (50% Fibonacci retracement of 1.0839-1.2093) should hold on first testing.
Recommendation: Buy at 1.1775 for 1.1975 with stop below 1.1675.
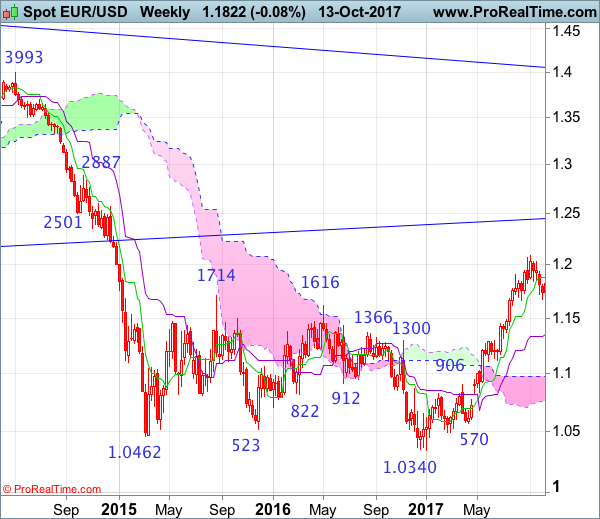
On the weekly chart, as euro has rebounded last week after finding support at 1.1669 and a white candlestick was formed, suggesting consolidation above this level would be seen with mild upside bias for gain to 1.1935-40, however, break of 1.2037 resistance is needed to retain bullishness and signal the pullback from 1.2093 has ended, bring retest of this level later. A break above there would extend recent rise from 1.0340 low to 1.2160-70 (50% Fibonacci retracement of 1.3993-1.0340) but loss of upward momentum should limit upside to 1.2220-30 and reckon 1.2300-10 would hold from here, price should falter well below 1.2390-00, bring another retreat later
On the downside, expect pullback to be limited to 1.1770-75 and last week’s ow at 1.1719 should remain intact, bring another rebound later. Only a drop below said support at 1.1669 would signal a temporary top has been formed at 1.2093, bring retracement of recent rise to 1.1610-15 (38.2% Fibonacci retracement of 1.0839-1.2093) and possibly towards 1.1550, having said that, downside should be limited to 1.1510-20 and 1.1460-70 (50% Fibonacci retracement) should remain intact, price should stay well above the Kijun-Sen (now at 1.1348, bring another rise.