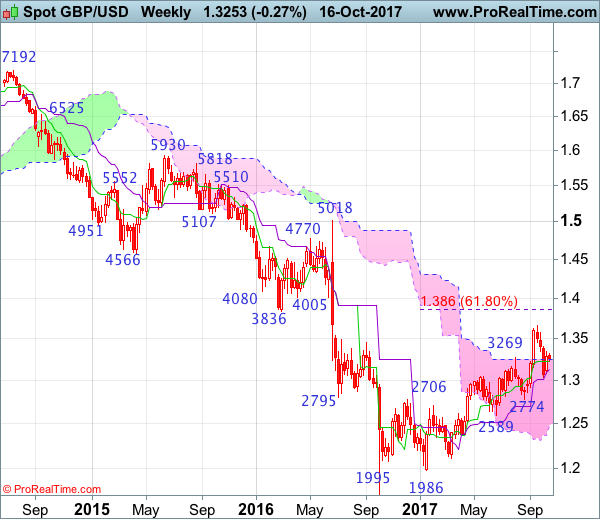
Weekly
• Last Candlesticks pattern: Shooting star
• Time of formation: 31 Jul 2017
• Trend bias: Down
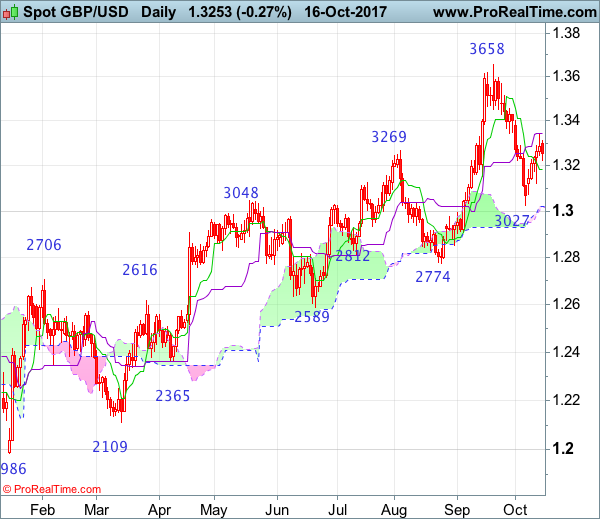
Daily
• Last Candlesticks pattern: Morning star
• Time of formation: 25 Aug 2017
• Trend bias: Near term up
GBP/USD – 1.3266
Despite retreating from 1.3265 to 1.3121, cable found renewed buying interest there and has staged another strong rebound later, dampening our bearishness and suggesting the rebound from 1.3027 low is still in progress, hence upside risk remains for test of the Kijun-Sen (now at 1.3343), however, a daily close above there is needed to signal the fall from 1.3658 has ended, bring further gain to resistance at 1.3455 and possibly towards resistance at 1.3596 but price should falter well below said recent high at 1.3658, bring another leg of corrective decline later.
On the downside, whilst pullback to 1.3195-00 cannot be ruled out, said support at 1.3121 should remain intact, bring another rebound later. A daily close below this level would suggest the rebound from 1.3027 has ended and revive bearishness for further fall to 1.3080, then retest of 1.3027. A break below this support would retain bearishness and extend the fall from 1.3658 top for retracement of recent upmove to 1.2940-50, then 1.2900 but reckon downside would be limited to 1.2850-55 and support at 1.2774 should remain intact.
Recommendation: Stand aside for this week.
On the weekly chart, cable found good support at 1.3121 last week and staged a strong rebound, a white candlestick was formed, hence consolidation with mild upside bias is seen, above resistance at 1.3338 would extend the rebound from 1.3027 to resistance at 1.3403 but still reckon upside would be limited to 1.3505-10 and bring another leg of corrective decline later. Only break of 1.3571 resistance would signal the pullback from 1.3658 has ended instead, risk retest of this last month’s high, break there would extend recent erratic rise from 1.1986 low to 1.3750-60 and 1.3800 but overbought condition should prevent sharp move beyond 1.3860 (61.8% Fibonacci retracement of 1.5018-1.1986).
On the downside, expect pullback to be limited to 1.3170-75 and said support at 1.3121 should remain intact, bring another rebound. A weekly close below 1.3121 support would signal the rebound from 1.3027 low has ended, bring further fall to 1.3070-80, then retest of 1.3027, break of this support would add credence to our view that top has been formed at 1.3658, bring further fall to 1.3000, then towards support at 1.2909, however, oversold condition should prevent sharp fall below previous chart support at 1.2774 and price should stay well above another previous chart support at 1.2589, bring rebound later.