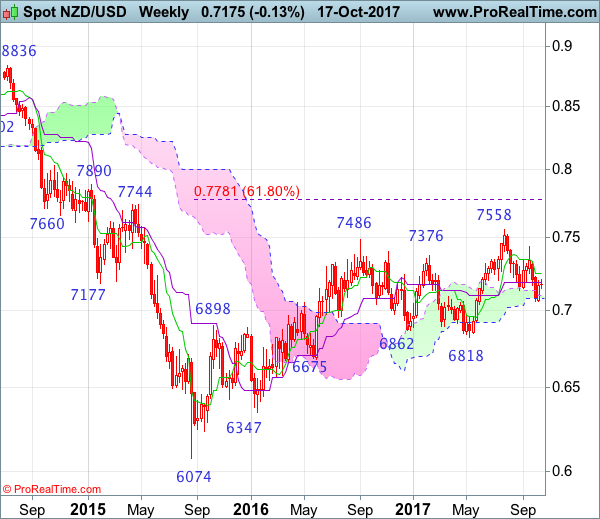
Weekly
• Last Candlesticks pattern: N/A
• Time of formation: N/A
• Trend bias: Up
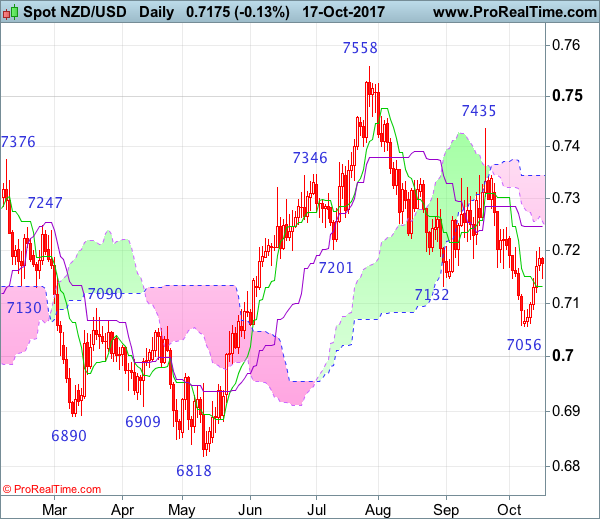
Daily
• Last Candlesticks pattern: Shooting star
• Time of formation: 20 Sep 2017
• Trend bias: Up
NZD/USD – 0.7135
Although kiwi extended recent decline to as low as 0.7056 (with a doji star on the daily chart) earlier this month, the subsequent rebound suggests a minor low has been formed there and consolidation with initial mild upside bias would be seen for another corrective bounce to 0.7244-46 (previous resistance and current level of the Kijun-Sen), however, reckon upside would be limited to 0.7270-75 and bring another decline later. A daily close below 0.7120-25 would suggest the rebound from 0.7056 has possibly ended, bring retest of this level later, break there would extend recent fall from 0.7558 top to 0.7000-10 (psychological support and 100% projection of 0.7558-0.7132 measuring from 0.7435) and possibly 0.6950 but reckon 0.6890-00 would hold from here.
On the upside, whilst initial recovery to 0.7210 cannot be ruled out, reckon upside would be limited to the Kijun-Sen (now at 0.7246) and bring another decline. Only a break of resistance at 0.7344 would abort and signal low has been formed at 0.7056, bring a stronger rebound to 0.7400 and then test of key resistance at 0.7435. Only a breach above there would shift risk back to upside and signal the corrective decline from 0.7558 has ended, bring further gain to 0.7500. then towards said resistance at 0.7558.
Recommendation: Sell again at 0.7250 for 0.7050 with stop above 0.7350.
On the weekly chart, although kiwi extended recent fall to as low as 0.7056 last week, the subsequent rebound formed a white candlestick, hence consolidation above this level would be seen and recovery towards the Tenkan-Sen (now at 0.7246) cannot be ruled out, however, reckon 0.7280-75 would limit upside and bring another decline later. Below 0.7120-25 would bring retest of 0.7056 but break there is needed to signal the fall from 0.7558 top is still in progress for further decline to 0.7000-10 (psychological support and 100% projection of 0.7558-0.7132 measuring from 0.7435), having said that, near term oversold condition should limit downside to 0.6950 and reckon 0.6880 would hold from here.
On the upside, expect recovery to be limited to the Tenkan-Sen (now at 0.7246) and 0.7300 should hold, bring another decline. Only above indicated resistance at 0.7435 would abort and shift risk back to upside, this would also suggest the pullback from 0.7558 has ended instead, bring further gain to 0.7500. Only a break of 0.7558 would extend medium term erratic upmove from 0.6074 (2015 low) to 0.7690-00 (61.8% projection of 0.6074-0.7485 measuring from 0.6818) and later towards 0.7780-85 (61.8% Fibonacci retracement of 0.8836-0.6074), however, reckon upside would be limited to 0.7890 and price should falter well below resistance at 0.8035.