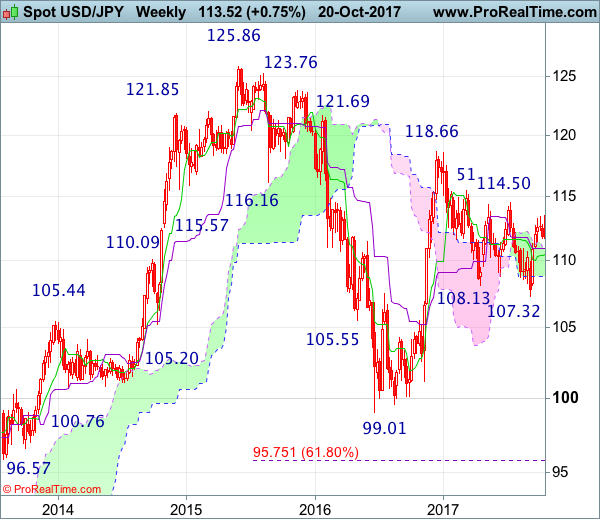
Weekly
• Last Candlesticks pattern: Dark cloud cover
• Time of formation: 10 Jul 2017
• Trend bias: Down
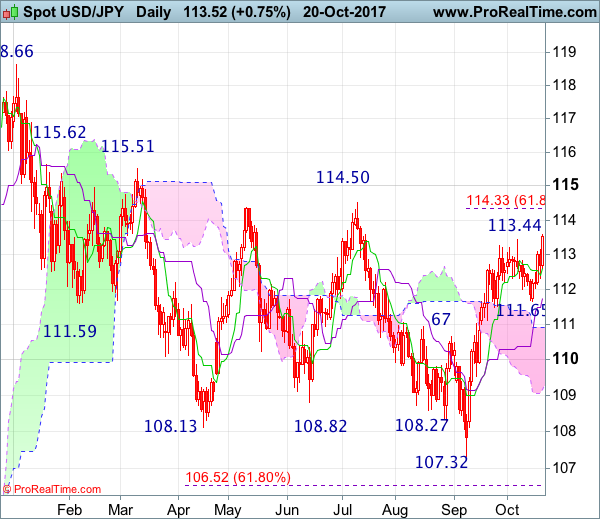
Daily
• Last Candlesticks pattern: Evening doji
• Time of formation: 7 Aug 2017
• Trend bias: Down
USD/JPY – 113.74
The greenback found renewed buying interest at 111.65 early last week and has staged a strong rebound from there, dampening our near term bearishness and upside risk remains for the rise from 107.32 low to extend further gain to towards 114.30-35 (61.8% Fibonacci retracement of 118.66-107.32), however, a daily close above resistance at 114.50 is needed to retain bullishness and suggest the fall from 118.66 has ended, then upside bias remains for headway to 115.00 and then towards 115.50-55.
On the downside, whilst pullback to 113.00 cannot be ruled out, reckon the Tenkan-Sen (now at 112.61) would limit downside and extend further gain later. Below 112.30 would bring weakness to 112.00 but only break of said support at 111.65 would revive bearishness and suggest top is possibly formed, bring retracement of recent rise to 111.10-15, having said that, reckon downside would be limited to the upper Kumo (now at 110.91) and 110.00 should hold, price should stay well above previous support at 109.55, bring rebound later.
Recommendation : Stand aside for this week.
On the weekly chart, last week’s rebound after finding decent demand at 111.65 formed a white candlestick, suggesting the rise from 107.32 low is still in progress and mild upside bias is seen for this move to bring at least a retracement of the fall from 118.66 to 114.30-35 (61.8% Fibonacci retracement) but a sustained break above resistance at 114.50 is needed to signal the aforesaid decline has ended, bring further rise to psychological level at 115.00, then test of resistance at 115.51, break there would add credence to this view and encourage for headway to 116.50-60 first.
On the downside, expect pullback to be limited to 113.00 and 112.30 should hold, bring another rise later. Only below 111.65 would suggest a minor top is possibly formed, bring weakness to the Kijun-Sen (now at 110.91), however, only a weekly close below there would confirm the rebound from 107.32 has ended, bring further fall to 109.90-95 but still reckon support at 109.55 would contain downside and bring another rise later.