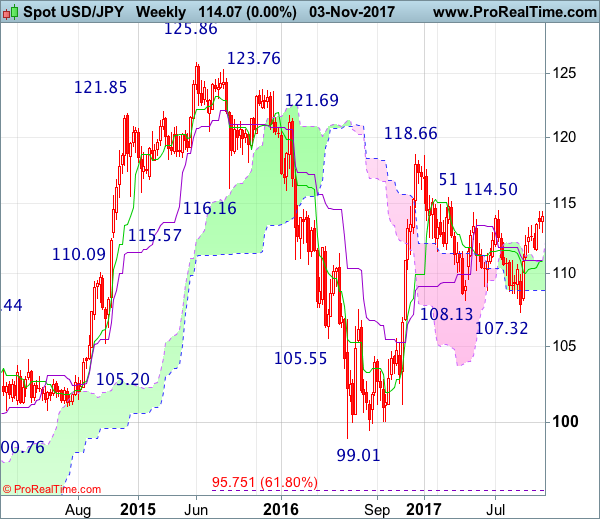
Weekly
• Last Candlesticks pattern: Dark cloud cover
• Time of formation: 10 Jul 2017
• Trend bias: Down
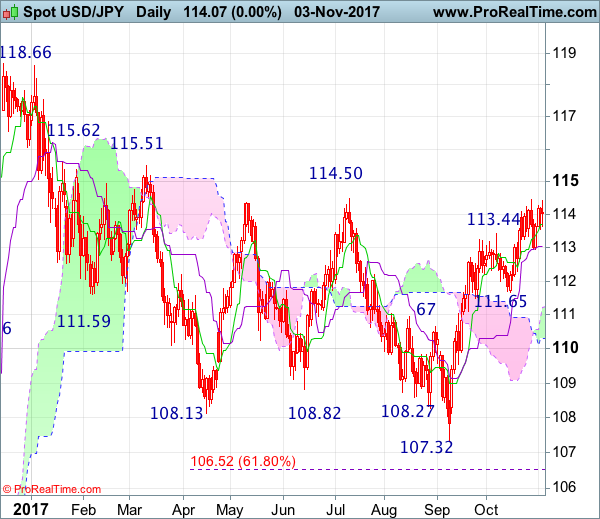
Daily
• Last Candlesticks pattern: Evening doji
• Time of formation: 7 Aug 2017
• Trend bias: Down
USD/JPY – 114.32
Dollar’s breach of previous resistance at 114.45-50 adds credence to the view that the fall from 118.66 has ended and upside bias remains for the rise from 107.32 to extend further gain to 115.00, then towards previous resistance at 115.51-62, however, loss of momentum should prevent sharp move beyond 116.00-10 and reckon 116.50-60 would hold from here, risk from there is seen for another retreat later.
On the downside, whilst initial pullback to 113.60-65 is likely, reckon the Kijun-Sen (now at 113.20) would contain downside and bring another rise later to aforesaid upside targets. Below support at 112.96 would defer and suggest a temporary top is formed instead, risk correction to 112.30 but still reckon downside would be limited to 112.00 and previous support at 111.65 should remain intact, bring rebound later.
Recommendation : Buy at 113.40 for 115.40 with stop below 112.40.
On the weekly chart, as the single currency has risen again after finding renewed buying interest at 112.96 last week and broke above indicated previous resistance at 114.45-50, suggesting the rise from 107.32 is still in progress, this also signal early erratic decline from 118.66 has ended at 107.32, hence consolidation with upside bias remains for further gain to 115.51-62 resistance, break there would extend gain towards 116.50-60 first, having said that, near term overbought condition should limit upside to 117.00-10, risk from there is seen for another retreat later.
On the downside, expect pullback to be limited to 113.40-50 and said support at 112.96 should remain intact, bring another rise later. A drop below 112.96 support would defer and suggest a temporary top is possibly formed instead, bring pullback to 112.30, then 112.00, however, previous support at 111.65 should hold. Only a break below this level would signal the rise from 107.32 low has ended, bring deeper correction to the Kijun-Sen (now at 111.03) which is likely to hold from here.