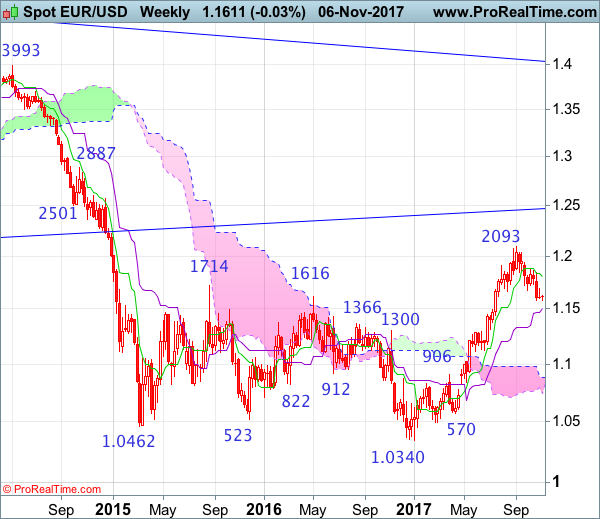
Weekly
• Last Candlesticks pattern: Shooting star
• Time of formation: 31 Jul 2017
• Trend bias: Near term up
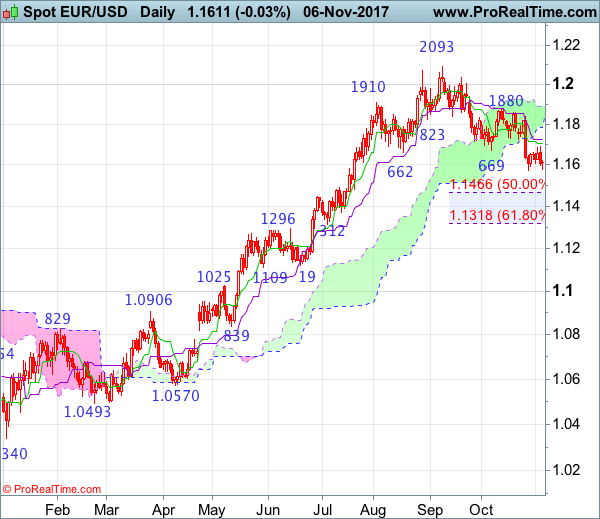
Daily
• Last Candlesticks pattern: Shooting star
• Time of formation: 2 Aug 2017
• Trend bias: Up
EUR/USD – 1.1605
As the single currency has remained under pressure, adding credence to our bearish view that the fall from 1.2093 top is still in progress, hence downside bias remains for the erratic fall from there to bring retracement of early upmove to 1.1550, then 1.1500, however, near term oversold condition should limit downside to 1.1465-66 (50% Fibonacci retracement of 1.0839-1.2093) and reckon 1.1370 support would hold and price should stay above 1.1312-18 (previous support and 61.8% Fibonacci retracement).
On the upside, whilst an initial recovery to 1.1660-70 cannot be ruled out, reckon the Tenkan-Sen (now at 1.1706) would limit upside and price should falter below 1.1725 (previous minor support), bring another decline to aforesaid downside targets. A daily close above the Kijun-Sen (now at 1.1727) would defer and suggest low is possibly formed instead, risk rebound to 1.1790-00, then test of resistance at 1.1837 but break there is needed to add credence to this view, bring another bounce to indicated previous resistance at 1.1880 first.
Recommendation: Sell at 1.1700 for 1.1500 with stop above 1.1800.
On the weekly chart, as euro’s retreat from 1.2093 has kept price under near term pressure, retaining our view that further consolidation below this level would be seen and mild downside bias remains for a retracement of recent rise to 1.1500, then 1.1466 (50% Fibonacci retracement of 1.0839-1.2093), however, reckon downside would be limited to 1.1400 and reckon 1.1312-18 (previous support and 61.8% Fibonacci retracement) would hold, price should stay above previous minor resistance at 1.1296, bring rebound later.
On the upside, expect recovery to be limited to 1.1650-60 and renewed selling interest should emerge around (1.1700-10), bring another decline later. Above 1.1790-00 would risk test of said resistance at 1.1837 but only break of this last week’s high would abort and suggest low is formed instead, bring test of resistance at 1.1880 first. Only a break of 1.1880 would suggest the pullback from 1.2093 top has possibly ended and extend gain to 1.1935-40, then towards 1.2035-40. Having said that, break there is needed to provide confirmation, bring retest of 1.2093.