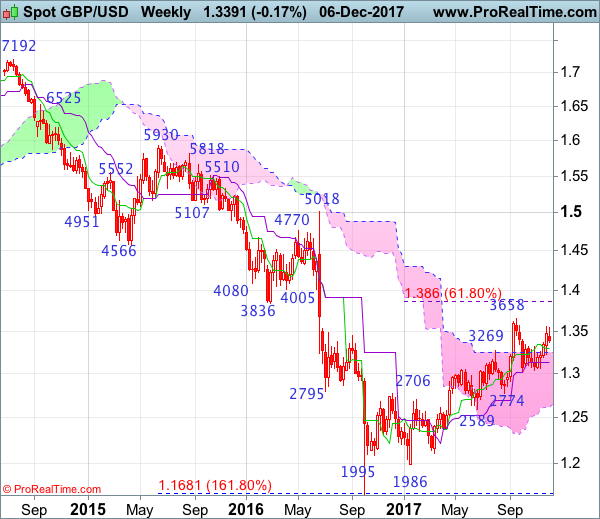
Weekly
• Last Candlesticks pattern: Shooting star
• Time of formation: 31 Jul 2017
• Trend bias: Down
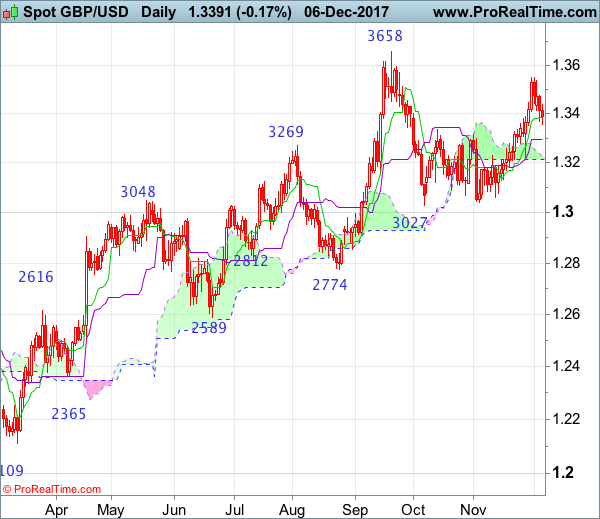
Daily
• Last Candlesticks pattern: Morning star
• Time of formation: 25 Aug 2017
• Trend bias: Near term up
GBP/USD – 1.3372
Although the British pound rose to as high as 1.3550 late last week, the subsequent retreat from there suggest top is possibly formed there and consolidation with mild downside bias is seen for weakness to the Kijun-Sen (now at 1.3295), however, a daily close below support at 1.3221 is needed to add credence to this view, bring further fall to 1.3185-90 and later towards 1.3130 but near term oversold condition should prevent sharp fall below there and price should stay above previous support at 1.3062, risk from there has increased for a rebound later.
On the upside, whilst recovery to 1.3450-60 cannot be ruled out, reckon upside would be limited to 1.3500 and bring another decline to aforesaid downside target. Only break of said last week’s high at 1.3550 would abort and signal the rise from 1.3027 is still in progress, then test of resistance at 1.3596 and price should falter below recent high at 1.3658. Looking ahead, a breach above this level is needed to retain bullishness and confirm medium term upmove has resumed and bring subsequent headway to 1.3770-80.
Recommendation: Sell at 1.3460 for 1.3260 with stop below 1.3560.
On the weekly chart, sterling ran into strong resistance around 1.3550 late last week and has retreated in part due to dollar;s broad-based rebound, suggesting consolidation below this level would be seen and mild downside bias is for a test of the Tenkan-Sen (now at 1.3295), a weekly close below this level would suggest top has possibly been formed, bring further fall to support at 1.3221, once this level is penetrated, this would add credence to this view, bring further fall to 1.3130 and later towards strong support at 1.3062. Looking ahead, only a drop below 1.3027 support would revive bearishness and signal top has indeed been formed at 1.3658, bring a stronger correction of early rise to 1.3000, then towards support at 1.2909.
On the upside, expect recovery to be limited to 1.3450-60 and 1.3500 should hold, bring another retreat later. Above 1.3550 (last week’s high) would shift risk back to the upside and extend the rise from 1.3027 to 1.3600, then test of last month’s high at 1.3658, break there would confirm medium term rise from 1.1986 low has resumed for headway to 1.3750-60 and 1.3800 but anticipated overbought condition should prevent sharp move beyond 1.3860 (61.8% Fibonacci retracement of 1.5018-1.1986).