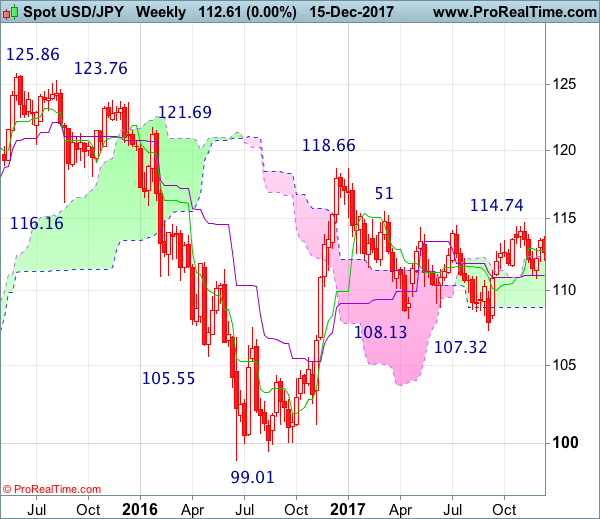
Weekly
• Last Candlesticks pattern: Dark cloud cover
• Time of formation: 10 Jul 2017
• Trend bias: Down
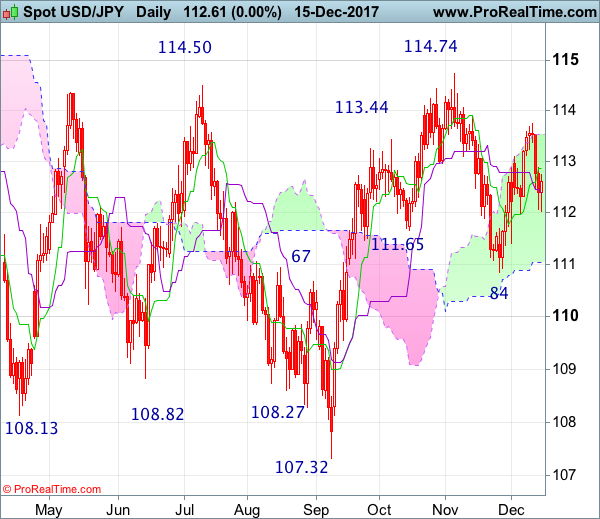
Daily
• Last Candlesticks pattern: Evening doji
• Time of formation: 7 Aug 2017
• Trend bias: Down
USD/JPY – 112.87
Although the greenback continued meeting resistance around 113.75 (two consecutive doji stars were formed on the daily chart) and retreated quite sharply (a long black candlestick was formed as well), as long as indicated support at 111.99 holds, further consolidation would be seen and mild upside bias remains for another rebound, above 113.30 would bring another test of 113.75 but break of previous resistance at 113.91 is needed to retain bullishness and confirm the fall from 114.74 has ended, bring further gain to 114.40-50 first.
On the downside, expect pullback to be limited to 112.30 and bring another rebound. A drop below 111.99 support would abort and signal top has been formed at 113.75 instead, bring further fall towards support at 111.41. Only below this support would shift risk to downside and signal the rebound from 110.84 low has ended, bring retest of this level. In the unlikely event that dollar drops below 110.84, this would signal the fall from 114.74 top has resumed for weakness to 110.00, then 109.50-60 but price should stay above 109.00-10.
Recommendation : Hold long entered at 112.10 for 114.10 with stop below 111.95
On the weekly chart, although the greenback edged higher to 113.75 early last week, lack of follow through buying and the subsequent retreat formed a black candlestick, suggesting consolidation below this level would be seen, however, still reckon support at 111.99 would limit downside and bring another rebound later, above 113.75 would extend gain to 114.00, break there would add credence to our view that the pullback from 114.74 has ended, bring retest of this level. Once this resistance is penetrated, this would signal the rise from 107.32 low has resumed for headway to 115.51-62 resistance area, break there would add credence to our view that early erratic decline from 118.66 has ended at 107.32, then upmove to 116.50-60 and possibly 117.00-10 would follow.
On the downside, expect pullback to be limited to 112.00-10 and bring another rebound later to aforesaid upside targets. Below 111.41 support would abort and suggest the rebound from 110.84 has ended instead, bring retest of this level, break there would extend the fall from 114.74 to 110.00-10, then 109.50-60 but reckon downside would be limited to 109.00 and 108.10-15 should hold from here.