AUD/USD – 0.7562
AUD/USD – Wave 5 of C and (B) has possibly ended at 1.1081
Aussie found decent demand at 0.7372 and has staged a stronger-than-expected rebound, the breach of previous resistance at 0.7518 signals the fall from 0.7750 has ended at 0.7329 and mild upside bias is seen for further gain towards resistance at 0.7611, however, break there is needed to retain bullishness and signal the fall from 0.7750 has ended there, bring further gain towards another previous resistance at 0.7680 but price should falter below said resistance at 0.7750.
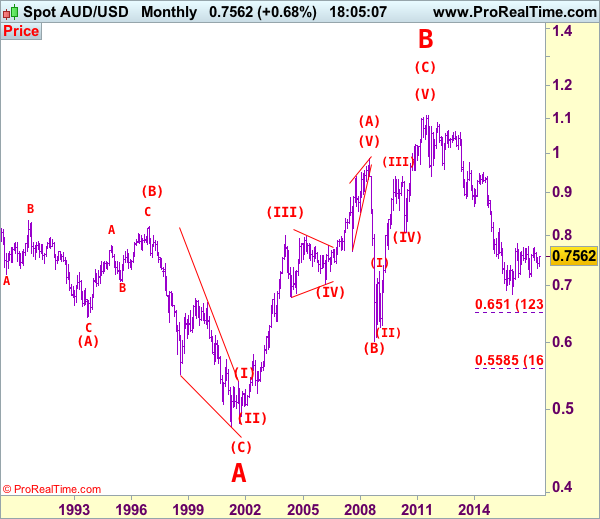
We are keeping our count that top has been formed at 1.1081 (wave 5 of V) and major correction (A-B-C-X-A-B-C) has commenced, indicated downside targets at 0.7945 (61.8% Fibonacci retracement of entire rise from 0.6007-1.1081) and 0.7750 had been met and downside bias is seen for further weakness to 0.6800, then 0.6700 but reckon 0.6500 would hold from here.
Our preferred count is that the rally from 0.6007 to 0.7270 (7 Jan 2009) is marked as wave A, the retreat to 0.6248 (2 Feb 2009) is wave B and the subsequent upmove is labeled as wave C with wave (iii) and wave (iv) ended at 0.8265 and 0.7700 respectively and wave (v) as well as 3 ended at 0.9407, then wave 4 ended at 0.8066 (instead of 0.8578). The wave 5 has met our indicated projection target of 1.1060 and could ended at 1.1081, this level is now treated as the peak of wave (C) as well as larger degree wave B, hence major fall in wave C has commenced, our initial downside target at psychological support at 0.7000 has just been met and further weakness to 0.6500 would be seen later.
On the downside, whilst pullback to 0.7500 cannot be ruled out, reckon downside would be limited to 0.7455-60 and bring another rise later. Only below support at 0.7415 would abort and suggest top is possibly formed, bring weakness towards said strong support at 0.7372 which is likely to hold from here. Looking ahead, a break below this support is needed to signal the rebound from 0.7329 has ended and revive bearishness for retest of this level later.
Recommendation: Exit short entered at 0.7490 and stand aside.
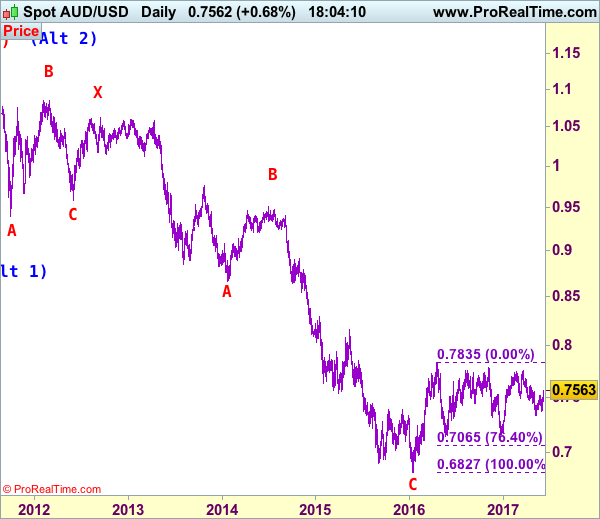
Our alternate count on the daily chart treated the top formed in 2008 at 0.9851 could be a larger degree wave I and was followed by a deep and sharp correction in wave II to 0.6007 and wave III is unfolding from there.
The long-term uptrend started from 0.4775 (2 Apr 2001) with an impulsive structure. Wave I is labeled as 0.4775 to 0.9851 (15 Jul 2008), wave II has ended at 0.6007 (Oct 2008) and wave III is still in progress which may extend further gain to 1.1265.