
GBP/USD – 1.2692
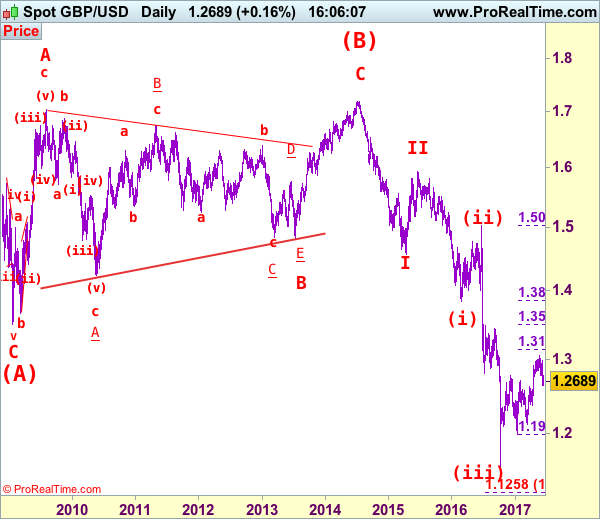
GBP/USD – Wave 4 is unfolding as an (A)-(B)-(C) and could have ended at 1.7192
As the British pound ran into heavy offers at 1.2978 late last week and has dropped sharply, price then broke below support at 1.2769, suggesting top has been formed at 1.3048 earlier and consolidation with mild downside bias is seen for the retreat from there to bring retracement of recent upmove to previous resistance at 1.2616 (tentatively wave i top), a break below there would bring correction of recent upmove to 1.2550, then towards 1.2500 which is likely to hold on first testing due to near term oversold condition.
Our preferred count on the daily chart is that cable’s rebound from 1.3500 (wave (A) trough) is unfolding as a wave (B) with A ended at 1.7043, followed by triangle wave B and wave C as well as wave (B) has possibly ended at 1.7192, below support at 1.4232 would add credence to this count, then further fall to 1.4000 level would follow but reckon downside would be limited to 1.3655 support and price should stay above previous support at 1.3500.
On the upside, although recovery to 1.2700, then 1.2750-60 cannot be ruled out, reckon resistance at 1.2803 (Friday’s high) would limit upside and bring another decline later. Above 1.2885-90 would suggest low is possibly formed, bring a stronger rebound towards resistance at 1.2978 which is likely to hold from here. Looking ahead, only a break above 1.2978 would signal the correction from 1.3048 top has ended, bring retest of this level later. A break above there would extend recent upmove from 1.1986 low to 1.3140-50 (38.2% Fibonacci retracement of 1.5018-1.1986) and possibly 1.3200.
Recommendation: Sell at 1.2800 for 1.2550 with stop above 1.2900.
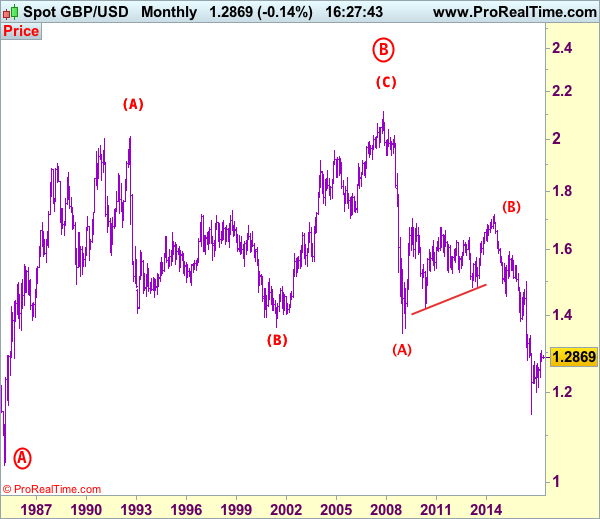
Longer term – Cable’s rise from 1.0520 (Feb 1985) to 2.0100 (September 1992) is seen as [A], the decline to 1.3682 is labeled as (B) and (C) wave rally has ended at 2.1162 (9 Nov, 2007) which is also the top of larger degree wave B with circle. The selloff from there is a 5-waver with wave (A) ended at 1.3500 (23 Jan 2009), wave (B) itself is labeled as A: 1.6733, triangle wave B: 1.4813 and wave C as well as top of wave (B) ended at 1.7192 (2014), hence the selloff from there is an impulsive wave (C) with wave I : 1.4566, wave II 1.5930, an extended wave III is unfolding and already exceeded our downside target at 1.3500 and 1.3000, hence weakness to 1.2500 and possibly 1.2000 cannot be ruled out, however, price should stay well above psychological level at 1.0000.


