GBP/USD – 1.3235
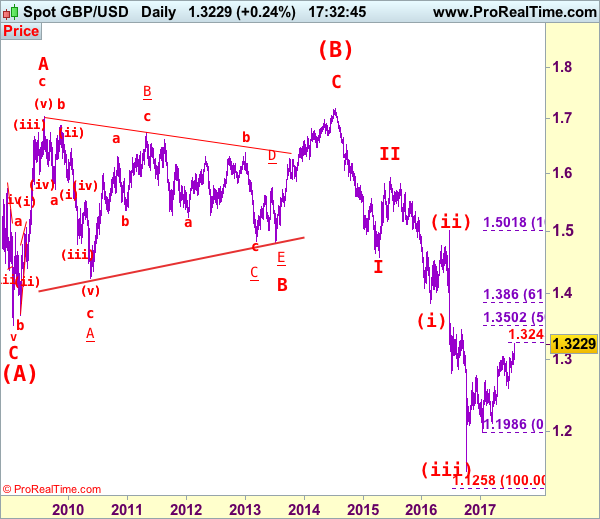
GBP/USD – Wave 4 is unfolding as an (A)-(B)-(C) and could have ended at 1.7192
Cable has surged in part due to dollar’s broad-based weakness and the breach of 1.3126 resistance signals recent erratic upmove from 1.1986 low is still in progress and may extend further gain to 1.3300-10 and possibly 1.3140-50 (38.2% Fibonacci retracement of 1.5018-1.1986), however, near term overbought condition should limit upside to 1.3200-10 and price should falter below 1.3300-10, risk from there is seen for a retreat later.
Our preferred count on the daily chart is that cable’s rebound from 1.3500 (wave (A) trough) is unfolding as a wave (B) with A ended at 1.7043, followed by triangle wave B and wave C as well as wave (B) has possibly ended at 1.7192, below support at 1.4232 would add credence to this count, then further fall to 1.4000 level would follow but reckon downside would be limited to 1.3655 support and price should stay above previous support at 1.3500.
On the downside, whilst initial pullback to 1.3170 and possibly 1.3120-30 cannot be ruled out, reckon 1.3095-00 would limit downside and bring another rise later. Only below 1.3050-55 would abort and signal top is possibly formed, bring test of 1.2999 support, break of this level would add credence to this view, bring retracement of recent rise to 1.2950-55 and possibly test of key support at 1.2933.
Recommendation: Stand aside for this week.
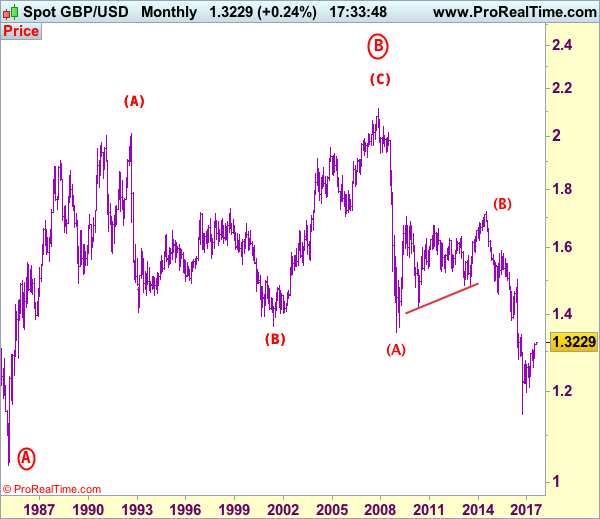
Longer term – Cable’s rise from 1.0520 (Feb 1985) to 2.0100 (September 1992) is seen as [A], the decline to 1.3682 is labeled as (B) and (C) wave rally has ended at 2.1162 (9 Nov, 2007) which is also the top of larger degree wave B with circle. The selloff from there is a 5-waver with wave (A) ended at 1.3500 (23 Jan 2009), wave (B) itself is labeled as A: 1.6733, triangle wave B: 1.4813 and wave C as well as top of wave (B) ended at 1.7192 (2014), hence the selloff from there is an impulsive wave (C) with wave I : 1.4566, wave II 1.5930, an extended wave III is unfolding and already exceeded our downside target at 1.3500 and 1.3000, hence weakness to 1.2500 and possibly 1.2000 cannot be ruled out, however, price should stay well above psychological level at 1.0000.