
EUR/GBP – 0.8932
EUR/GBP – The major (A)(B)(C)-(X)-(A)(B)(C) correction from 0.9805 is unfolding and 2nd (A) has possibly ended at 0.6936.
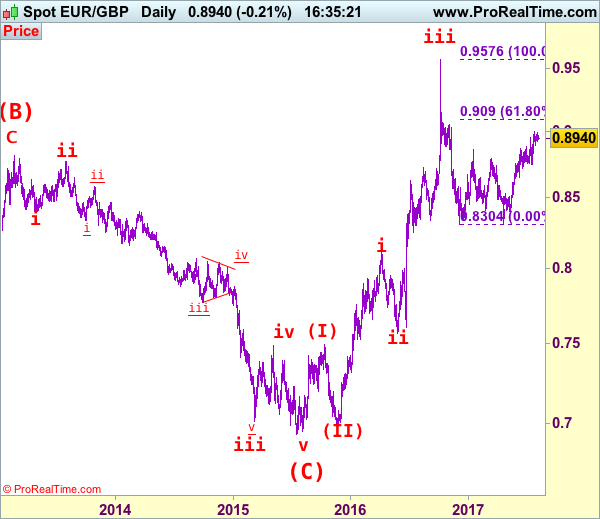
As the single currency has maintained a firm undertone after breaking above previous resistance at 0.8950, adding credence to our bullish view that recent rise from 0.8304 (Dec 2016) is still in progress and upside bias remains for further gain to psychological resistance at 0.9000, break there would encourage for headway to 0.9090 (61.8% Fibonacci retracement of 0.9576-0.8304), having said that, break of previous resistance at 0.9142 is needed to signal the retreat from 0.9576 top (2016 high) has ended at 0.8304, bring headway to 0.9200-10 first.
Our latest preferred count is that the wave V of a 5-wave series from 0.5682 ended at 0.9805 earlier and major from there has possibly ended at 0.8067 as A-B-C-X-A-B-C. We are keeping our view that the entire correction from 0.9805 has possibly ended at 0.7756 and as labeled as the attached daily chart and impulsive move from 0.9084 has ended at 0.7756 as a 5-waver which marked either the (C) wave or the A leg of (C), a daily close above resistance at 0.8831 would suggest (C) leg has ended and headway towards 0.9084.
On the downside, whilst initial pullback to 0.8845-50 cannot be rule out, reckon 0.8825-30 would limit downside and bring another rise later. A daily close below 0.8780-85 would defer and suggest a temporary top is possibly formed, bring test of support at 0.9743 but break there is needed to add credence to this view, bring retracement of recent upmove to 0.8700, then towards previous support at 0.8652 which is likely to hold from here.
Recommendation: Buy at 0.8830 for 0.9030 with stop below 0.8730
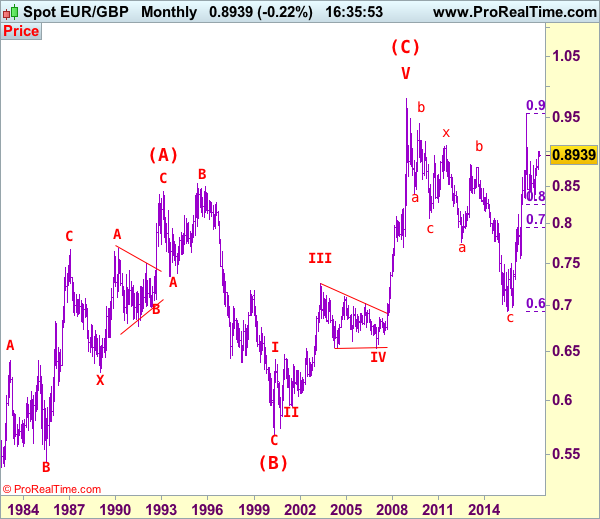
Euro’s long term uptrend started in Feb 1981 at 0.5039 and is unfolding as a (A)-(B)-(C) move with (A): 0.8433 (Feb 1993), (B): 0.5682 (May 2000) and impulsive wave (C) should have ended at 0.9805 with wave III ended at 0.7254 (May 2003), triangle wave IV at 0.6536 (23 Jan 2007) and wave V as well as wave (C) has ended at 0.9805.
We are keeping an alternate count that only wave III ended at 0.9805 and the correction from there is the wave IV and may extend weakness to 0.7700, however, it is necessary to see a daily close above resistance at 0.9143 would change this to be the preferred count.


