GBP/JPY – 146.05
Sterling only recovered to 143.20 before dropping again, the pair exceeded all our downside targets (including 141.25, 140.00 and 139.85), however, as the British pound found support at 139.35 and has rebounded, suggesting consolidation above this level would be seen and another bounce to 141.40-45, then 142.00 cannot be ruled out, however, reckon said resistance at 143.20 would limit upside and bring another decline. A break of said support at 139.35 would signal the fall from 147.75 is still in progress and bring test of previous chart support at 138.70 which is likely to hold on first testing.
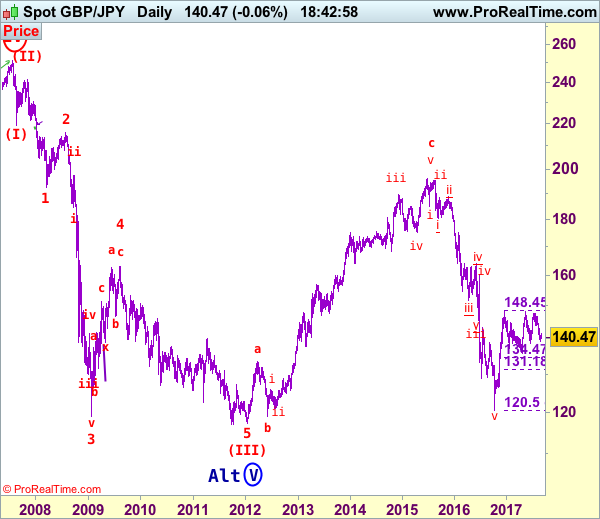
Our preferred count is that larger degree wave V with circle is unfolding from 251.12 with wave (I) 219.34, (II): 241.38 and wave (III) is subdivided into 1: 192.60, 2: 215.89 (23 Jul 2008) and wave 3 ended at 118.87 earlier in 2009. The correction from there to 162.60 is wave 4 which itself is a double three and is labeled as first a-b-c ended at 151.53, followed by wave x at 139.03, 2nd a ended at 162.60, 2nd b at 146.75 and 2nd c leg of wave 4 ended at 163.00. Therefore, the decline from 163.00 to 116.85 is now treated as wave 5 which also marked the end of larger degree wave (III), hence wave (IV) major correction has commenced for retracement of the wave (III) from 241.38 and upside target at 183.95-00 (50% Fibonacci retracement of the wave (II) from 241.38) had been met, a drop below 160.00 would suggest wave (IV) has ended at 195.85, bring decline in wave (V) for initial weakness to 130 (already met) and 120.
On the upside, although current rebound from 139.35 may bring initial recovery to 142.00 and possibly 142.40-50, reckon upside would be limited and renewed selling interest should emerge around 143.20 resistance, bring another decline later. A daily close above 143.20 would defer and suggest the fall from 147.75 has formed a temporary low and bring a stronger rebound to 144.00 and possibly towards 144.50-60 before prospect of another decline next month.
Recommendation: Sell again at 143.15 for 140.15 with stop above 145.50.
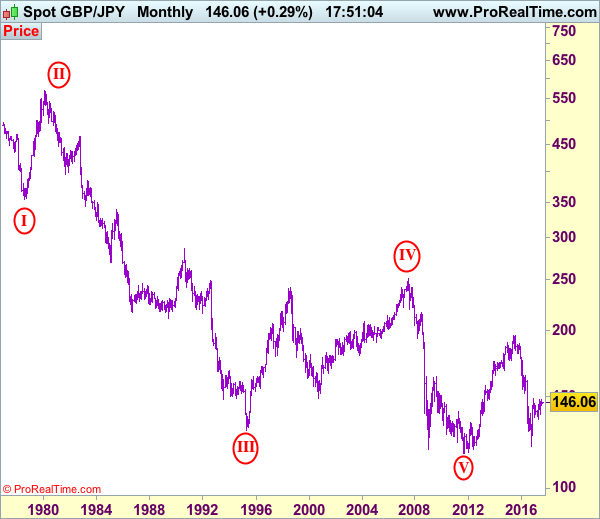
The long-term downtrend from 570.99 (29 Feb 1980) is labeled as an impulsive wave with III with circle ended at 129.77 (20 Apr 1995) and the corrective rebound to 251.12 (20 Jul 2007) is treated as wave IV with circle and the wave V with circle selloff from 251.12 has possibly ended at 116.80 (almost reached our indicated target at 116.00) and major correction has commenced from there and indicated upside target at 183.90-00 (50% Fibonacci retracement of 251.10-116.85) had been met, reckon upside would be limited to 199.80-90 (61.8% Fibonacci retracement) and bring wave (V) decline in later part of 2017.