
EUR/CAD – 1.4975
Although the single currency broke above previous resistance at 1.5018, lack of follow through buying and current retreat from yesterday’s high of 1.5076 suggests consolidation below this level would be seen and pullback to 1.4900 is likely, however, downside should be limited to 1.4845-50 and support at 1.4726 should remain intact, bring further consolidation. Only a drop below said support at 1.4726 would shift risk to the downside and suggest the rebound from 1.4478 has ended and extend weakness to 1.4700, then 1.4640-50 but reckon 1.4590-00 would contain downside.
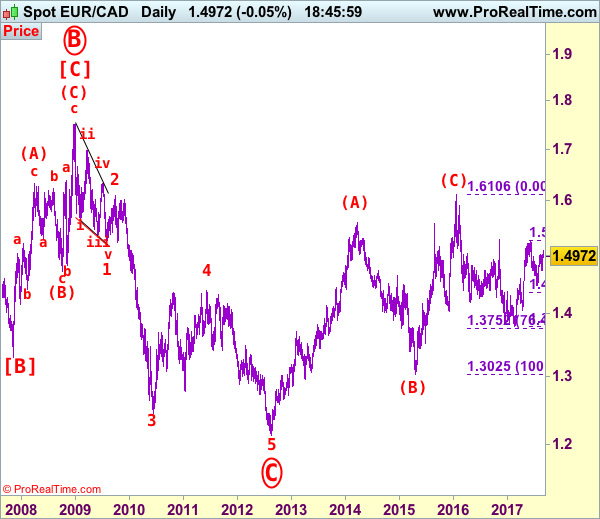
Our latest preferred count is that larger degree wave [C] from 1.3289 as well as circle wave B ended at 1.7509 in Dec 2008 with (A): 1.6325, (B): 1.4719 followed by wave (C) at 1.7509, hence circle wave C is unfolding with wave 1 ended at 1.5186 (diagonal wave 1), wave 2 at 1.6096, impulsive wave 3 has ended at 1.2451, followed by wave 4 at 1.4380, in view of recent strong rebound, we are now treating the wave 5 as well as larger degree circle wave C has ended at 1.2129, hence (A)-(B)-(C) correction has commenced from there with impulsive wave (C) now unfolding and indicated initial upside target at 1.6000 had been met and reckon 1.6500 would hold.
On the upside, expect recovery to be limited to 1.5040-50 and said resistance at 1.5076 should hold, bring retreat later. A firm break of 1.5076 would extend the erratic rise from 1.4478 to 1.5140-50, then towards 1.5200 but resistance at 1.5259 should remain intact. Looking ahead, only break of resistance at 1.5259 would retain bullishness and signal the erratic rise from 1.3784 has finally resumed and extend gain to 1.5282, then 1.5350 but near term overbought condition should limit upside to 1.5400-10, bring retreat later.
Recommendation: Stand aside for this week.
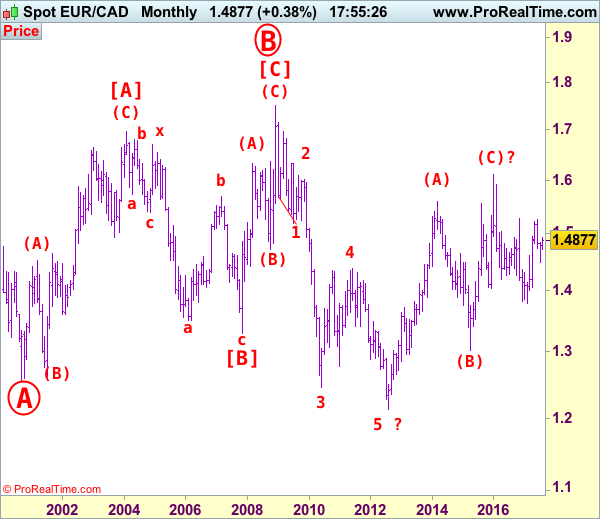
On the bigger picture, our long-term count on the monthly chart is that a big sideways consolidation from 2000 low of 1.2557 has possibly ended at 1.7509 as circle wave B with [A]: 1.6976 ( (A): 1.4513, (B): 1.2612, (C): 1.6976), wave [B]: 1.3289 is a double three with 1st a-b-c: 1.5384, x: 1.6709 and 2nd a-b-c: 1.3289. As indicated above, the wave [C] has ended at 1.7509. The selloff from there is now unfolding which itself should be labeled as an impulsive wave with wave 1: 1.5186 (diagonal wave 1), followed by wave 2: 1.6096 and wave 3: 1.2451, wave 4: 1.4380, wave 5 as well as larger degree circle wave C has possibly ended at 1.2129 and major correction has possibly commenced for retracement of recent decline towards 1.4000, then 1.4180-90 (38.2% Fibonacci retracement of 1.7509-1.2129). Below said support at 1.2129 would risk weakness to psychological support at 1.2000 and then 1.1851 (50% projection of 1.7509-1.2451 measuring from 1.4380) but reckon 1.1500 would remain intact, bring reversal later.


