USD/JPY – 112.07
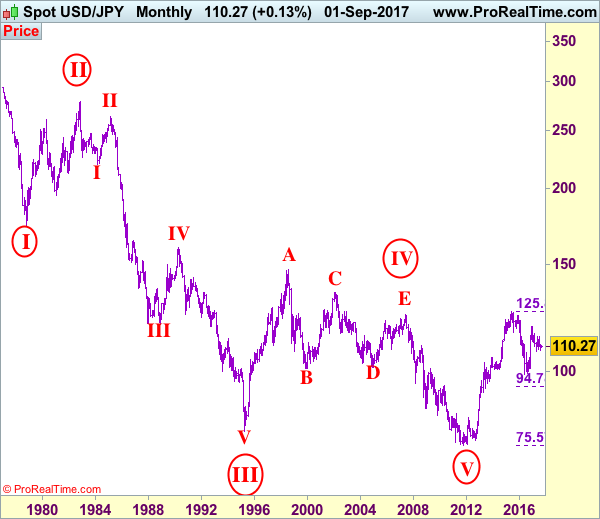
USD/JPY – Wave V of larger degree circle V has possibly ended at 75.31 and major correction has commenced and already met indicated target at 125.00.
The greenback surged again after brief pullback to 111.11, adding credence to our view that low has indeed been formed at 107.32 earlier this month and consolidation with upside bias remains for this move from 107.32 to bring at least a retracement of recent entire fall from 118.66 (indicated upside target at 111.65 – 38.2% Fibonacci retracement of 118.66-107.32 and 112.20-25 had been met last week) and bullishness remains for further subsequent rise to 112.95-00 (50% Fibonacci retracement) and later towards 113.50-60, however, near term overbought condition should limit upside to 114.30-35 (61.8% Fibonacci retracement) and price should fatter below resistance at 114.50, bring retreat later.
Our preferred count is that, triangle wave IV (with circle) ended at 101.45 and the circle wave V brought dollar down to the record low of 75.31 in 2011 and the subsequent rebound signal major correction has commenced with A leg ended at 84.19, followed by wave B at 77.14 and impulsive wave C is now unfolding (indicated upside target at 125.00 had been met) for gain towards 127.00 level. In the event dollar drops below support at 99.01, this would confirm medium term decline from 125.86 top (2015 high) has resumed for subsequent weakness to 98.00 and possibly 97.00.
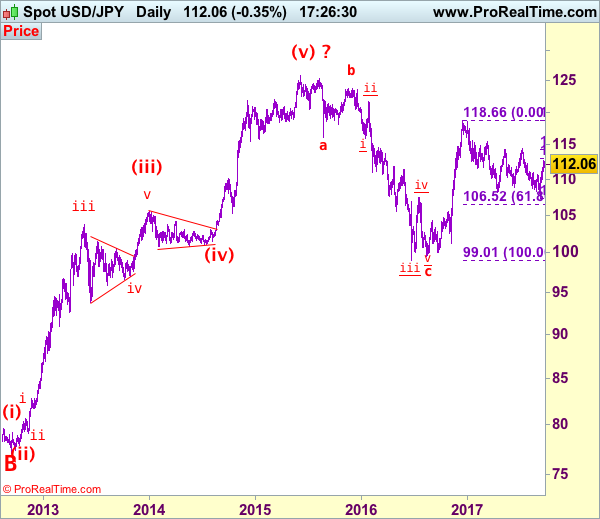
Under this count, this wave C is unfolding as impulsive waves with (1) (2), 1 2 ended at 80.67, 79.07, 82.84 and 81.69 respectively, hence the extended wave 3 has ended at 103.74 and wave 4 correction of recent upmove should bring weakness to 92.57, then towards 90.88 but psychological support at 90.00 should limit downside and bring another rally later in wave 5, indicated target at 125.00 had been met and gain to 127.00 cannot be ruled out but reckon price would falter below 130.00.
On the downside, whilst pullback to 111.60-65 is likely, reckon said support at 111.11 would limit downside and bring another rise to aforesaid upside targets later. A daily close below 111.11 would defer and risk weakness to 110.50-60, then towards 110.00 but support at 109.55 should remain intact. Only a drop below strong support at 109.55 would abort and suggest the rebound from 107.32 has ended instead, risk weakness to 109.00 and possibly 108.50-60 but price should stay well above said support at 107.32 and bring another rebound later.
Recommendation: Buy at 111.15 for 113.15 with stop below 110.15.
On the monthly chart, we have changed our preferred count that an impulsive wave is unfolding with major wave III with circle ended at 79.75, then followed by wave IV with circle and is labeled as a triangle with A: 147.64 (11 August, 1998), B: 101.25, C: 135.20, D: 101.67 and E leg ended at 124.14 to end the wave IV with circle. Hence, wave V with circle commenced from there and hit a record low of 75.31, however, the subsequent strong rebound signals this circle wave V has possibly ended there, hence gain to (indicated upside target at 122.00 and 125.00 had been met), the retreat from 125.86 suggests wave A of major correction has ended there and wave B correction back to 99.00, then 95.00 would be seen, however, reckon downside would be limited to 90.00, bring another rebound in wave C next year.