USD/CAD – 1.2455
Although the greenback edged higher to 1.2599 late last week, the subsequent retreat suggests consolidation below this level would be seen initially and pullback to 1.2445-50 is likely, however, reckon support at 1.2336 would hold and bring rebound later. Above said resistance at 1.2599 would signal the rise from 1.2061 low is still in progress for retracement of recent downtrend towards resistance at 1.2663 but loss of upward momentum should limit upside to 1.2700-10 and price should falter well below resistance at 1.2778, bring retreat later.
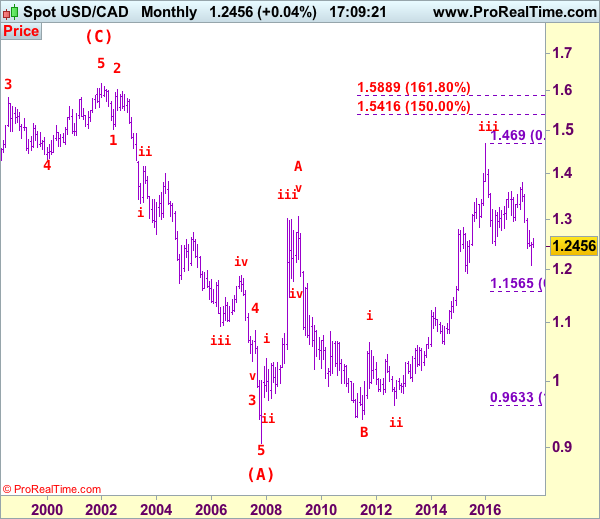
We are keeping our view that the wave b from 1.0657 (a leg top) has possibly ended at 0.9633 with (a): 0.9800, wave (b): 1.0447 and wave c at 0.9633, the subsequent rise from there is now treated as wave c exceeded indicated upside target at 1.3770-80 and 1.4000 and wave (3) has possibly ended at 1.4690 and wave (4) correction has commenced for retracement back towards 1.2000.
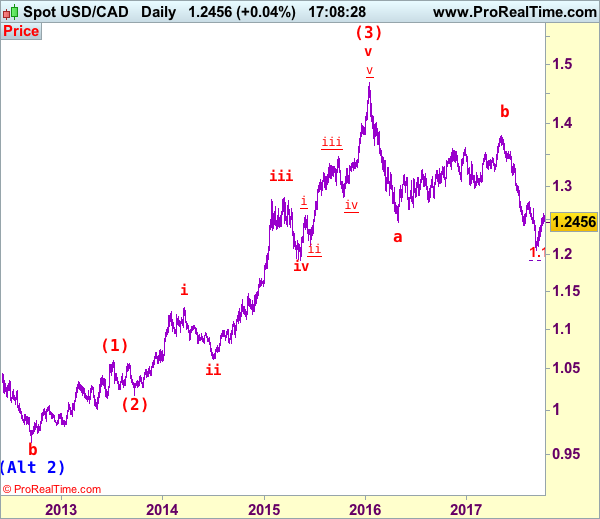
On the daily chart, our latest preferred count remains that the A of (B) rally from 0.9059 low (7 Nov 2007) unfolded into an impulsive wave with i: 0.9059-1.0380, ii ended at 0.9819, iii at 1.3019 followed by triangle wave iv at 1.2026 , then wave v formed a top at 1.3066 and also ended the wave A. The wave B is unfolding as an double three a-b-c-x-a-b-c and is sub-divided as a: 1.2192, b: 1.2716 and wave c at 1.0784, followed by wave x at 1.1725, another set of a-b-c unfolded with 2nd a at 0.9931, 2nd b at 1.0674. the 2nd c has possibly ended at 0.9407, therefore, consolidation with upside bias is seen for major correction, indicated target at 1.3900 had been met and gain to 1.4700 would follow.
On the downside, whilst initial pullback to 1.2400-10 cannot be ruled out, reckon downside would be limited and support at 1.2336 should hold, bring another rise later. Below 1.2310-15 would suggest the rebound from 1.2061 has ended instead, bring weakness to support at 1.2254, however, a daily close below this level is needed to add credence to this view, bring further fall towards another previous support at 1.2197 which is likely to hold from here. We are keeping our bearish count that wave b ended at 1.3794 and wave c has commenced for further fall towards psychological support at 1.2000.
Recommendation: Stand aside for this week.
Longer term – The selloff from 1.6194 (21 Jan 2002) to 0.9059 (07 Nov 2007) is viewed as (A) wave which is a 5-waver as labeled on the monthly chart as below, the subsequently rally is labeled as (B) with impulsive A leg of (B) ended at 1.3066, wave B of (B) is unfolding which has either ended at 0.9407 or would extend one more fall but downside should be limited to 0.9200 and 0.9000 should hold.