GBP/USD – 1.3254
Although sterling found good support at 1.3121 last week and staged another rebound, as 1.3338 capped cable’s upside and the pair has retreated since, retaining our bearishness, as long as this resistance holds, consolidation with mild downside bias remains for another retreat, a daily close below said support at 1.3121 would signal the rebound from 1.3027 low has ended and bring retest of this level. Looking ahead, a drop below this level would signal the fall from 1.3658 top has resumed for weakness to 1.3000, then towards 1.2950 but support at 1.2909 should limit downside and another previous support at 1.2852 would remain intact.
Our preferred count on the daily chart is that cable’s rebound from 1.3500 (wave (A) trough) is unfolding as a wave (B) with A ended at 1.7043, followed by triangle wave B and wave C as well as wave (B) has possibly ended at 1.7192, below support at 1.4232 would add credence to this count, then further fall to 1.4000 level would follow but reckon downside would be limited to 1.3655 support and price should stay above previous support at 1.3500.
On the upside, expect recovery to be limited to 1.3295-00 and bring another retreat. Above previous support at 1.3343 would defer and risk a stronger rebound to 1.3400 and possibly towards resistance at 1.3455, however, if our view that top has been formed at 1.3658 is correct, upside would be limited and bring another decline later.
Recommendation: Hold short entered at 1.3300 for 1.3050 with stop above 1.3345.
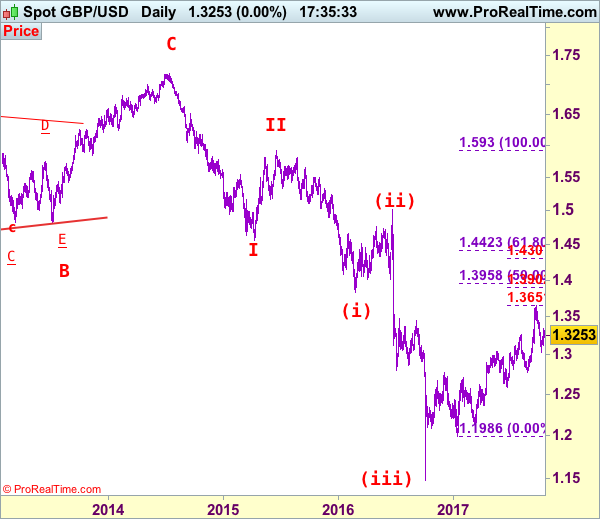
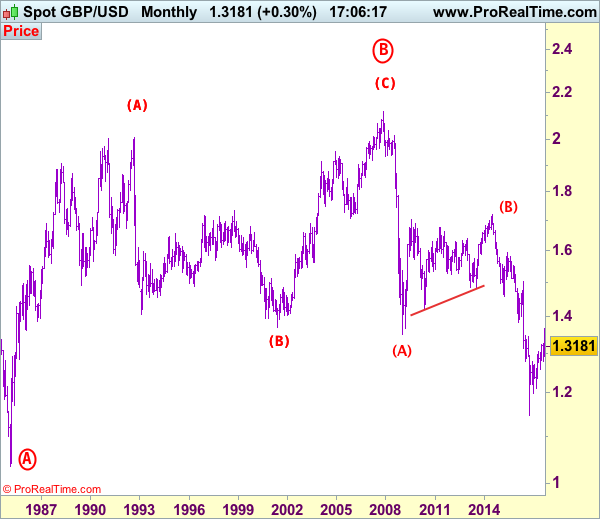
Longer term – Cable’s rise from 1.0520 (Feb 1985) to 2.0100 (September 1992) is seen as [A], the decline to 1.3682 is labeled as (B) and (C) wave rally has ended at 2.1162 (9 Nov, 2007) which is also the top of larger degree wave B with circle. The selloff from there is a 5-waver with wave (A) ended at 1.3500 (23 Jan 2009), wave (B) itself is labeled as A: 1.6733, triangle wave B: 1.4813 and wave C as well as top of wave (B) ended at 1.7192 (2014), hence the selloff from there is an impulsive wave (C) with wave I : 1.4566, wave II 1.5930, an extended wave III is unfolding and already exceeded our downside target at 1.3500 and 1.3000, hence weakness to 1.2500 and possibly 1.2000 cannot be ruled out, however, price should stay well above psychological level at 1.0000.